
Kubernetes Series (Article 6): Deepening Kubernetes Observability with the Kube-Prometheus Stack
After setting up my Kubernetes cluster on my homelab using Proxmox VE, I began exploring enterprise-grade tools to better understand and manage the complexities of a production-ready environment. Much like with my earlier Docker projects, I knew the importance of robust monitoring, and with Kubernetes, the need is even more critical. Monitoring a Kubernetes cluster isn’t as straightforward as tracking a few containers; instead, it involves overseeing a dynamic and often sprawling system of deployments, workloads, and nodes. Staying on top of performance, resource usage, and cluster health can become overwhelming without the right tools.
In a previous blog post (Kubernetes Series (Article 5)), I documented my experience deploying Rancher, which helped me visualise the architecture and resources of my Kubernetes cluster. That was a significant step toward understanding the environment, but I wanted deeper insight, especially node-level performance metrics and observability tools suitable for a serious production deployment.
That’s when I turned to Prometheus, Grafana, and the Kube-Prometheus Stack. This powerful combination of tools provides comprehensive monitoring and alerting for Kubernetes environments. The Kube-Prometheus Stack includes Prometheus and Grafana and integrates additional components like Alertmanager, Node Exporter, and Kube-state-metrics, making it a complete observability solution.
In this article, I’ll walk through the various components included in the Kube-Prometheus Stack, how I deployed them in my cluster, and how they work together to provide actionable insights into the state and performance of my Kubernetes environment. Whether running a homelab like me or managing production workloads, this stack will make your Kubernetes journey more observability-friendly.
This guide documents the complete setup of the kube-prometheus-stack on Kubernetes with:
- TLS-secured dashboards using cert-manager
- Basic authentication via Traefik middleware
- Secure metric scraping from control plane components
Available Grafana Dashboards
These dashboards are provisioned automatically via the Helm chart:
| Dashboard Category | Description | Source |
|---|---|---|
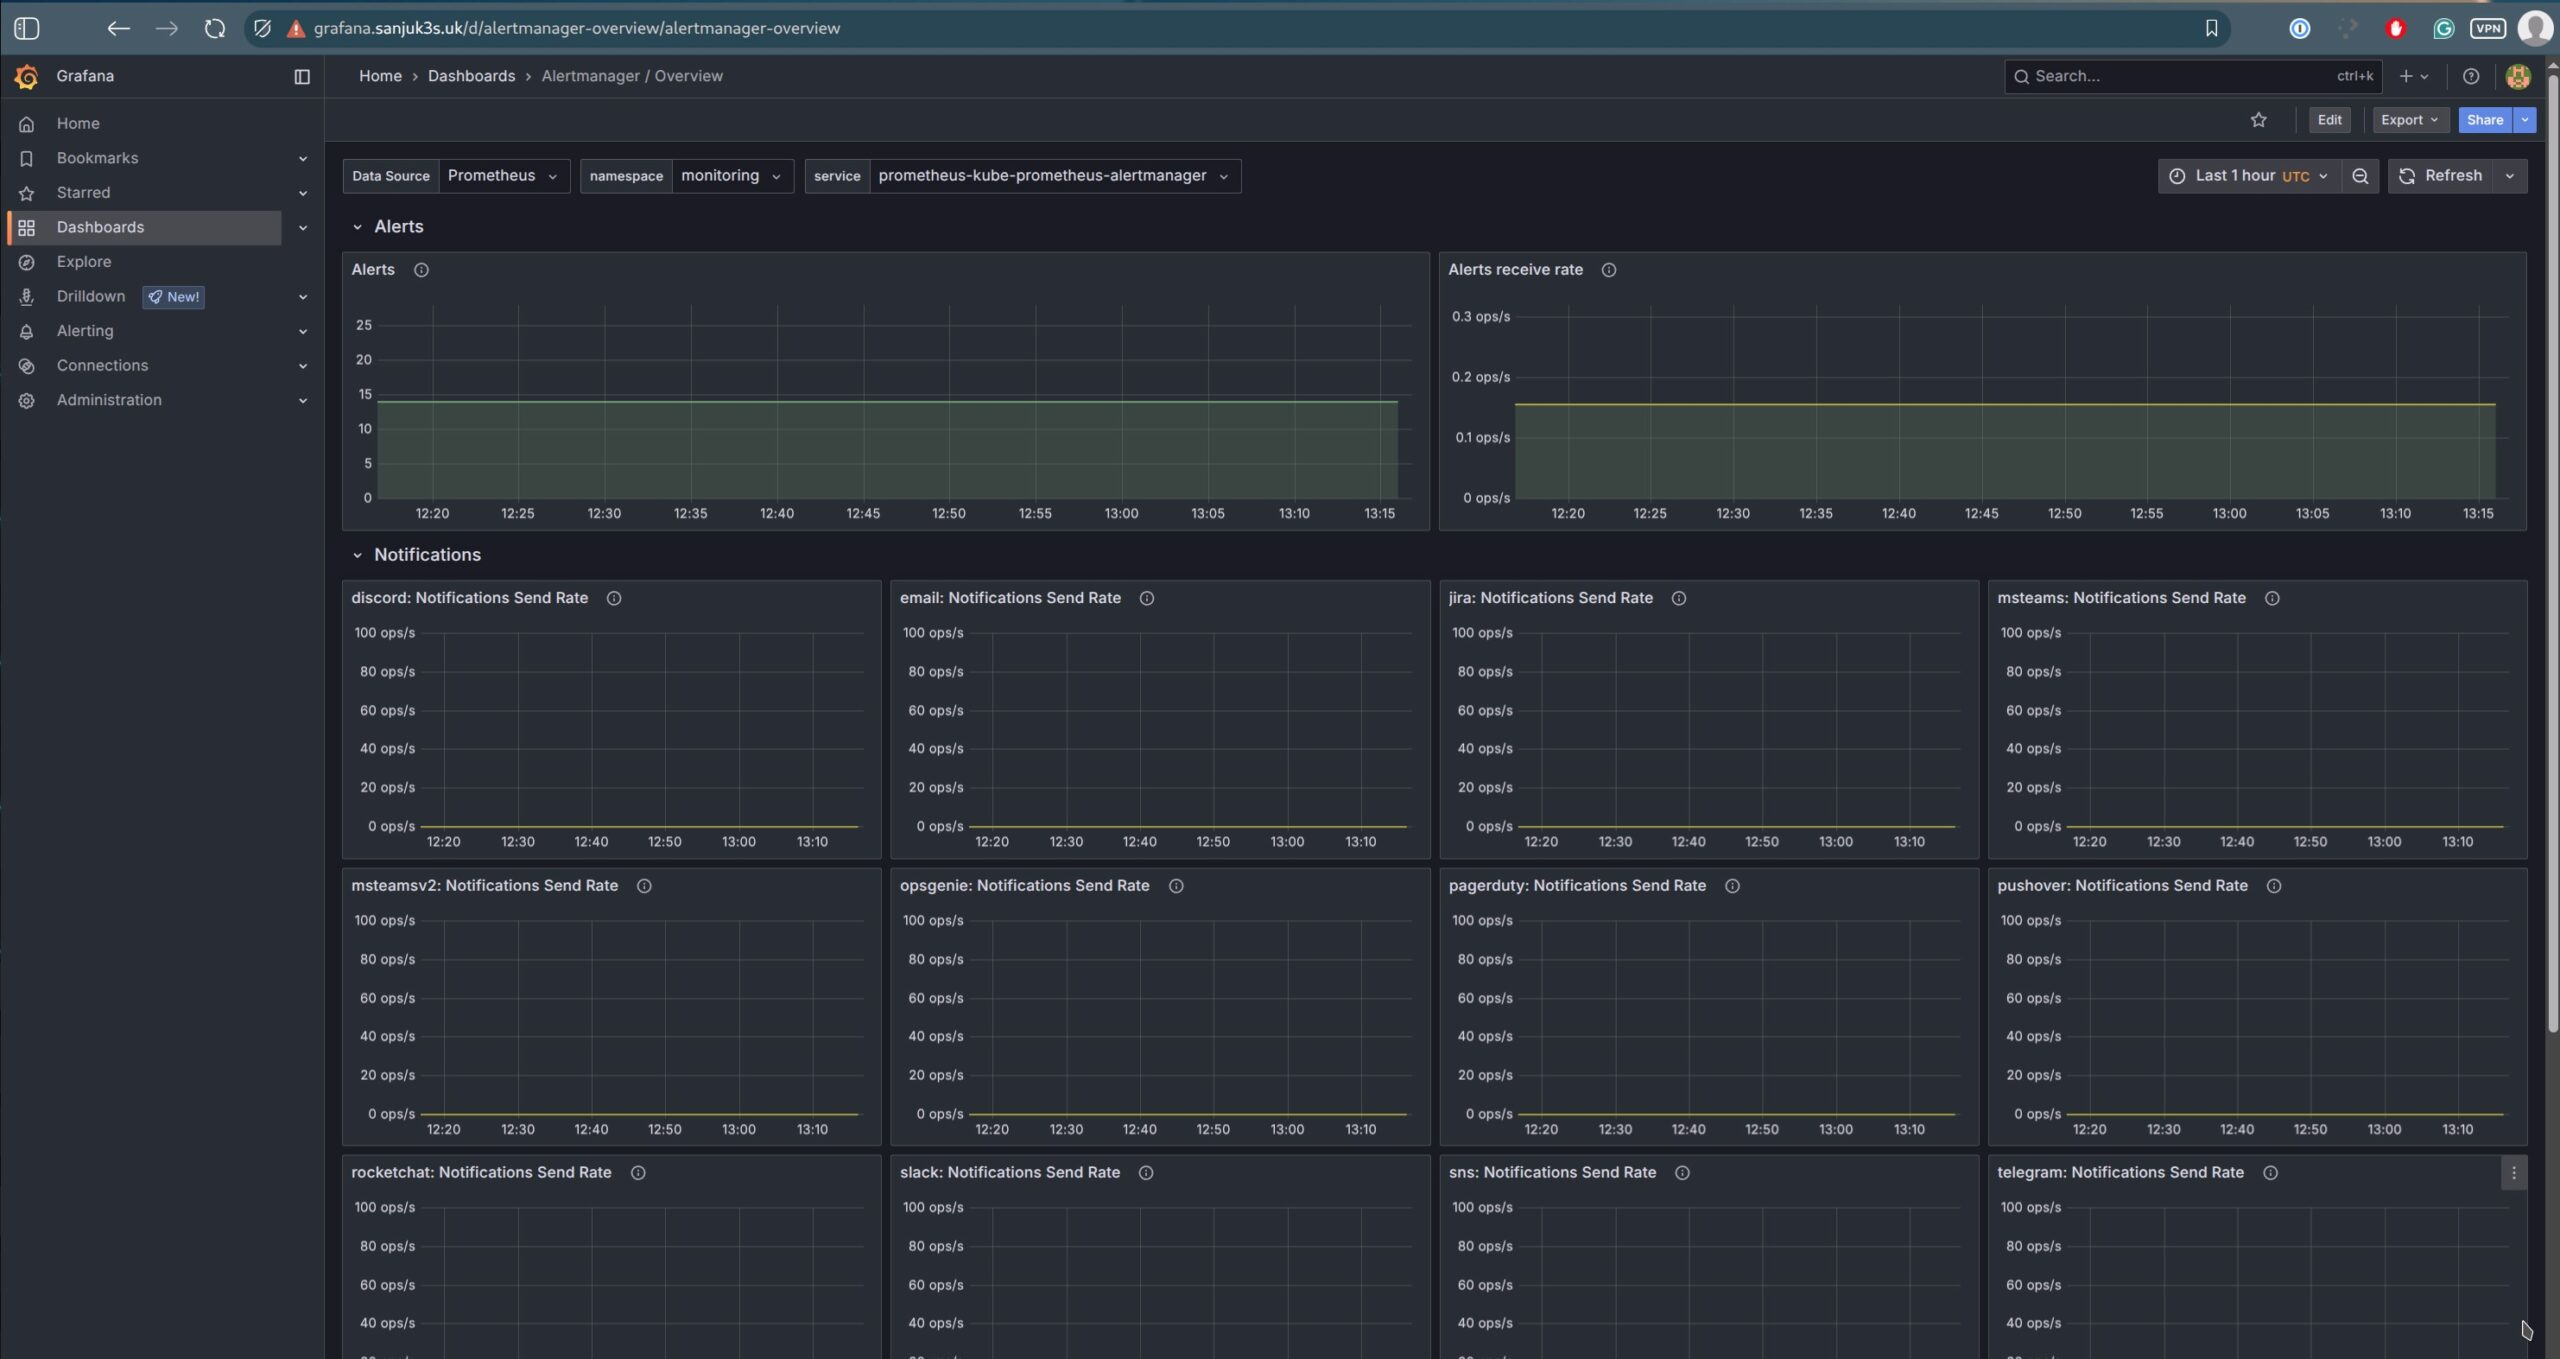
| Alertmanager | Alert queue, state, and notifications | alertmanager-mixin |
| CoreDNS | DNS queries, errors, latency | coredns |
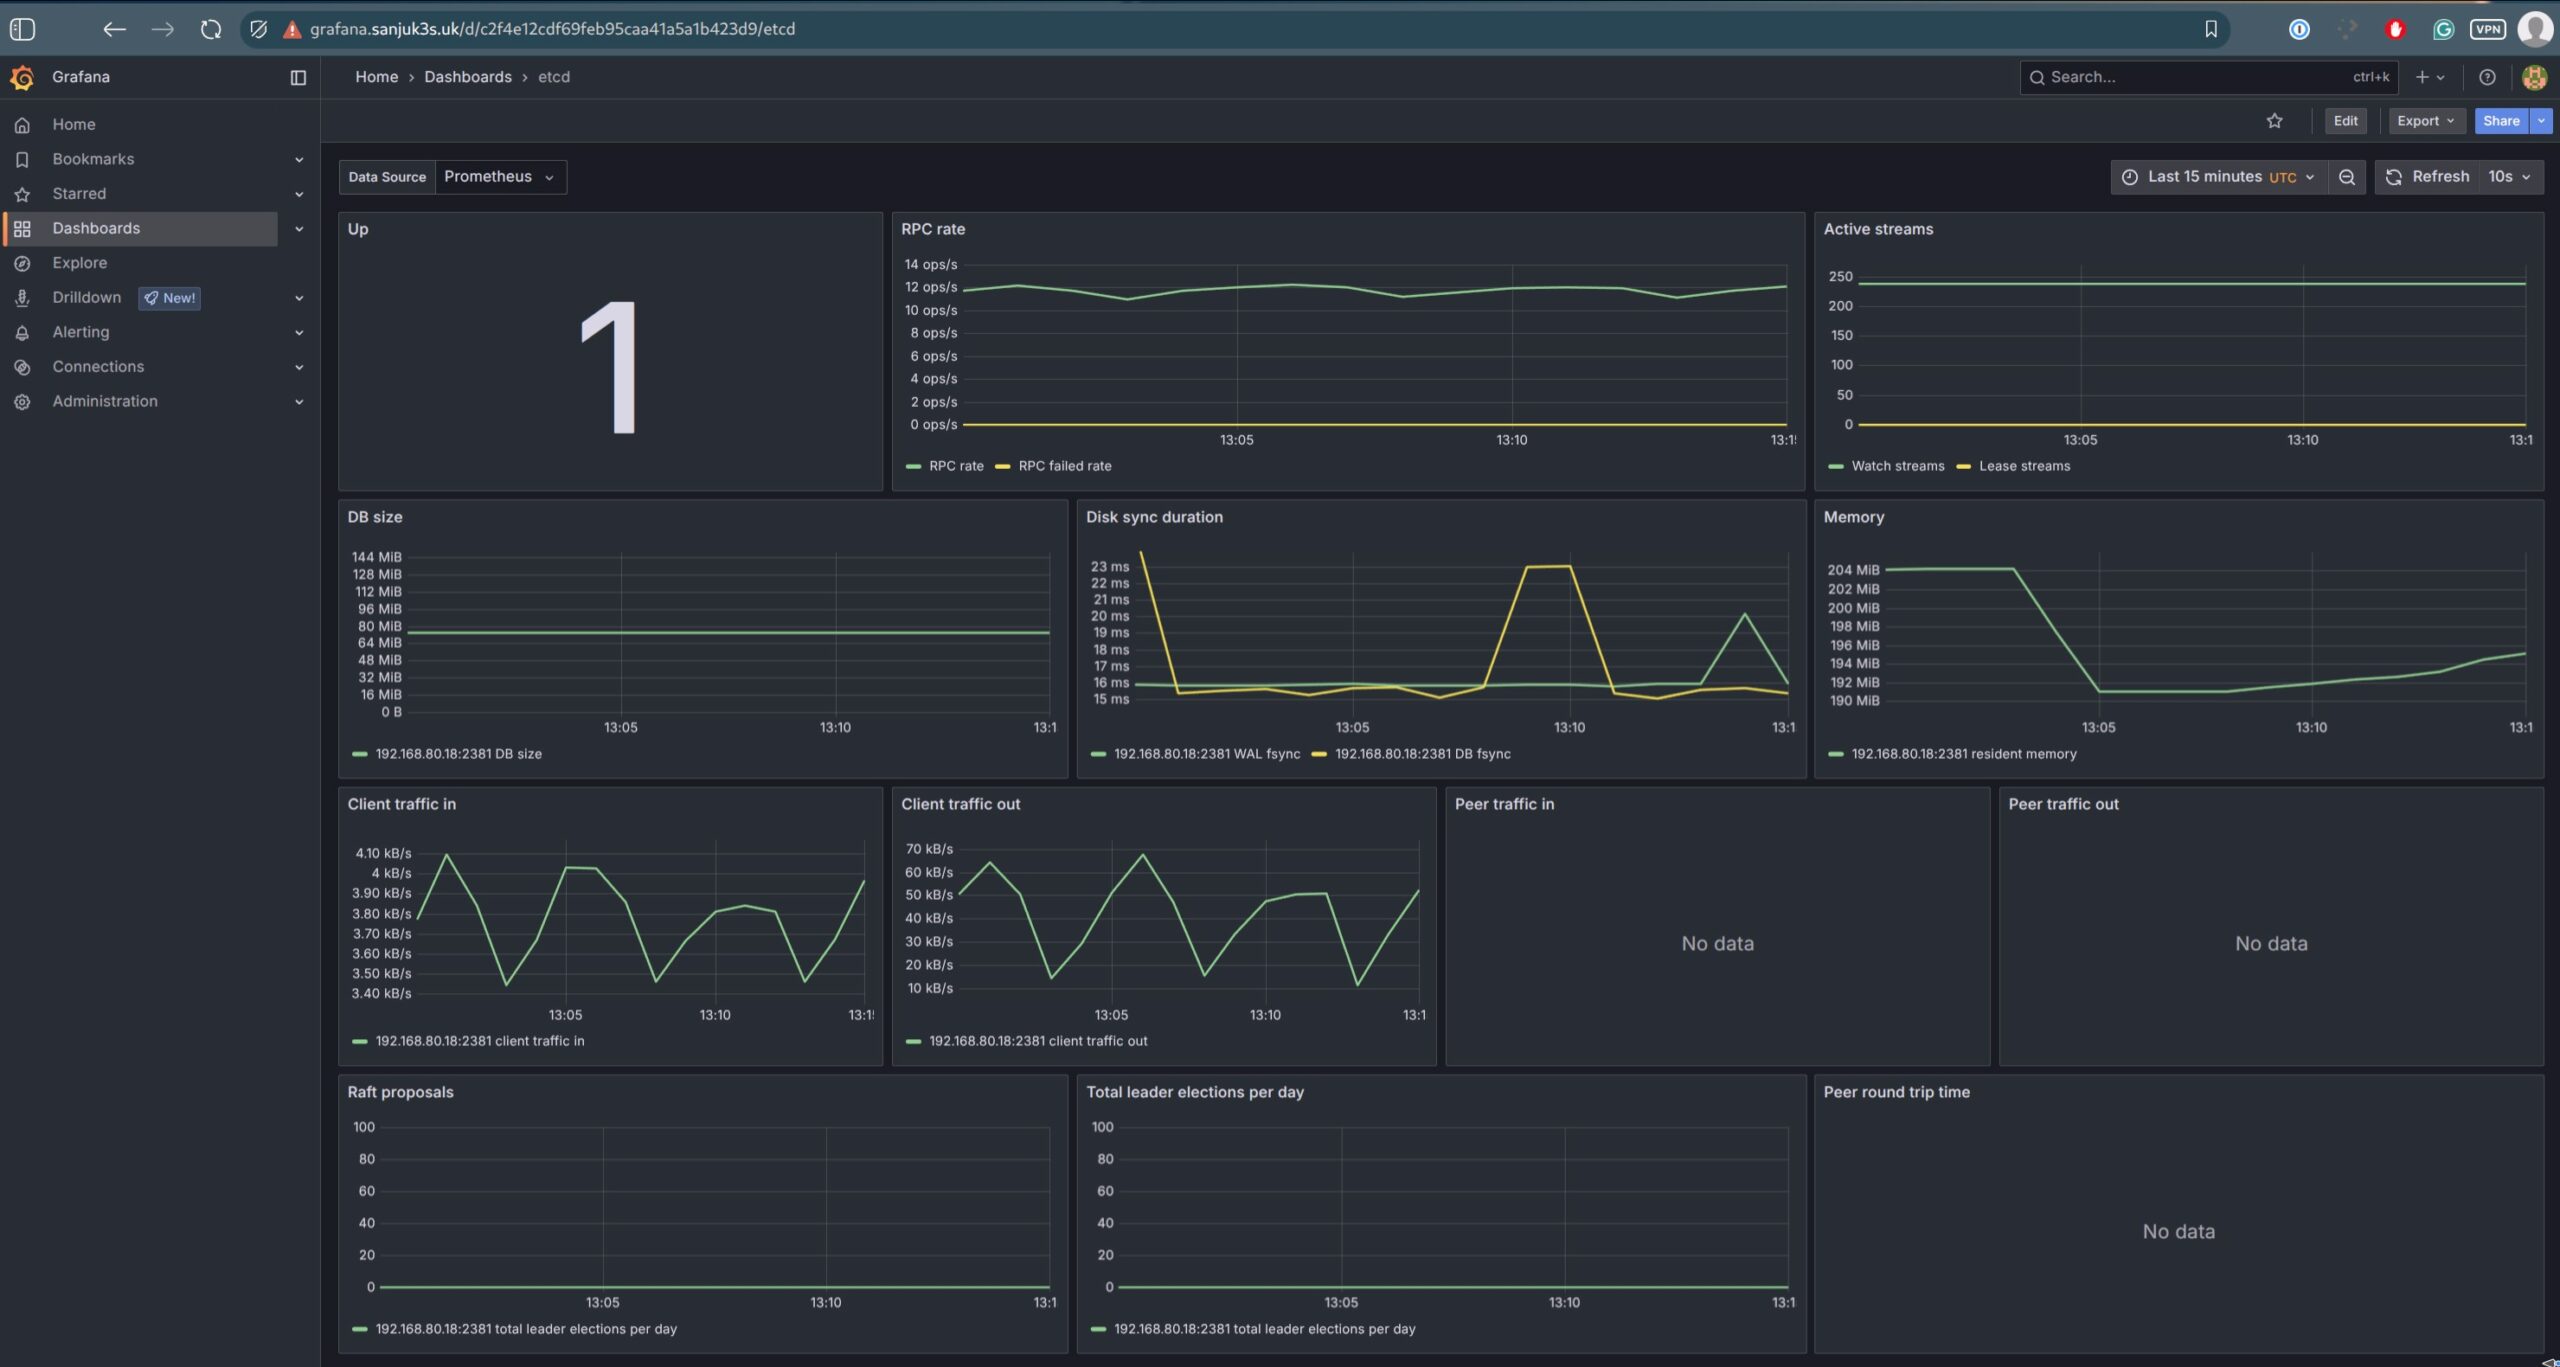
| etcd | Health, disk, and operation stats | etcd-mixin |
| Grafana Overview | Self-monitoring of Grafana | Built-in |
| Kubernetes API Server | Request latency, errors, traffic | kubernetes-mixin |
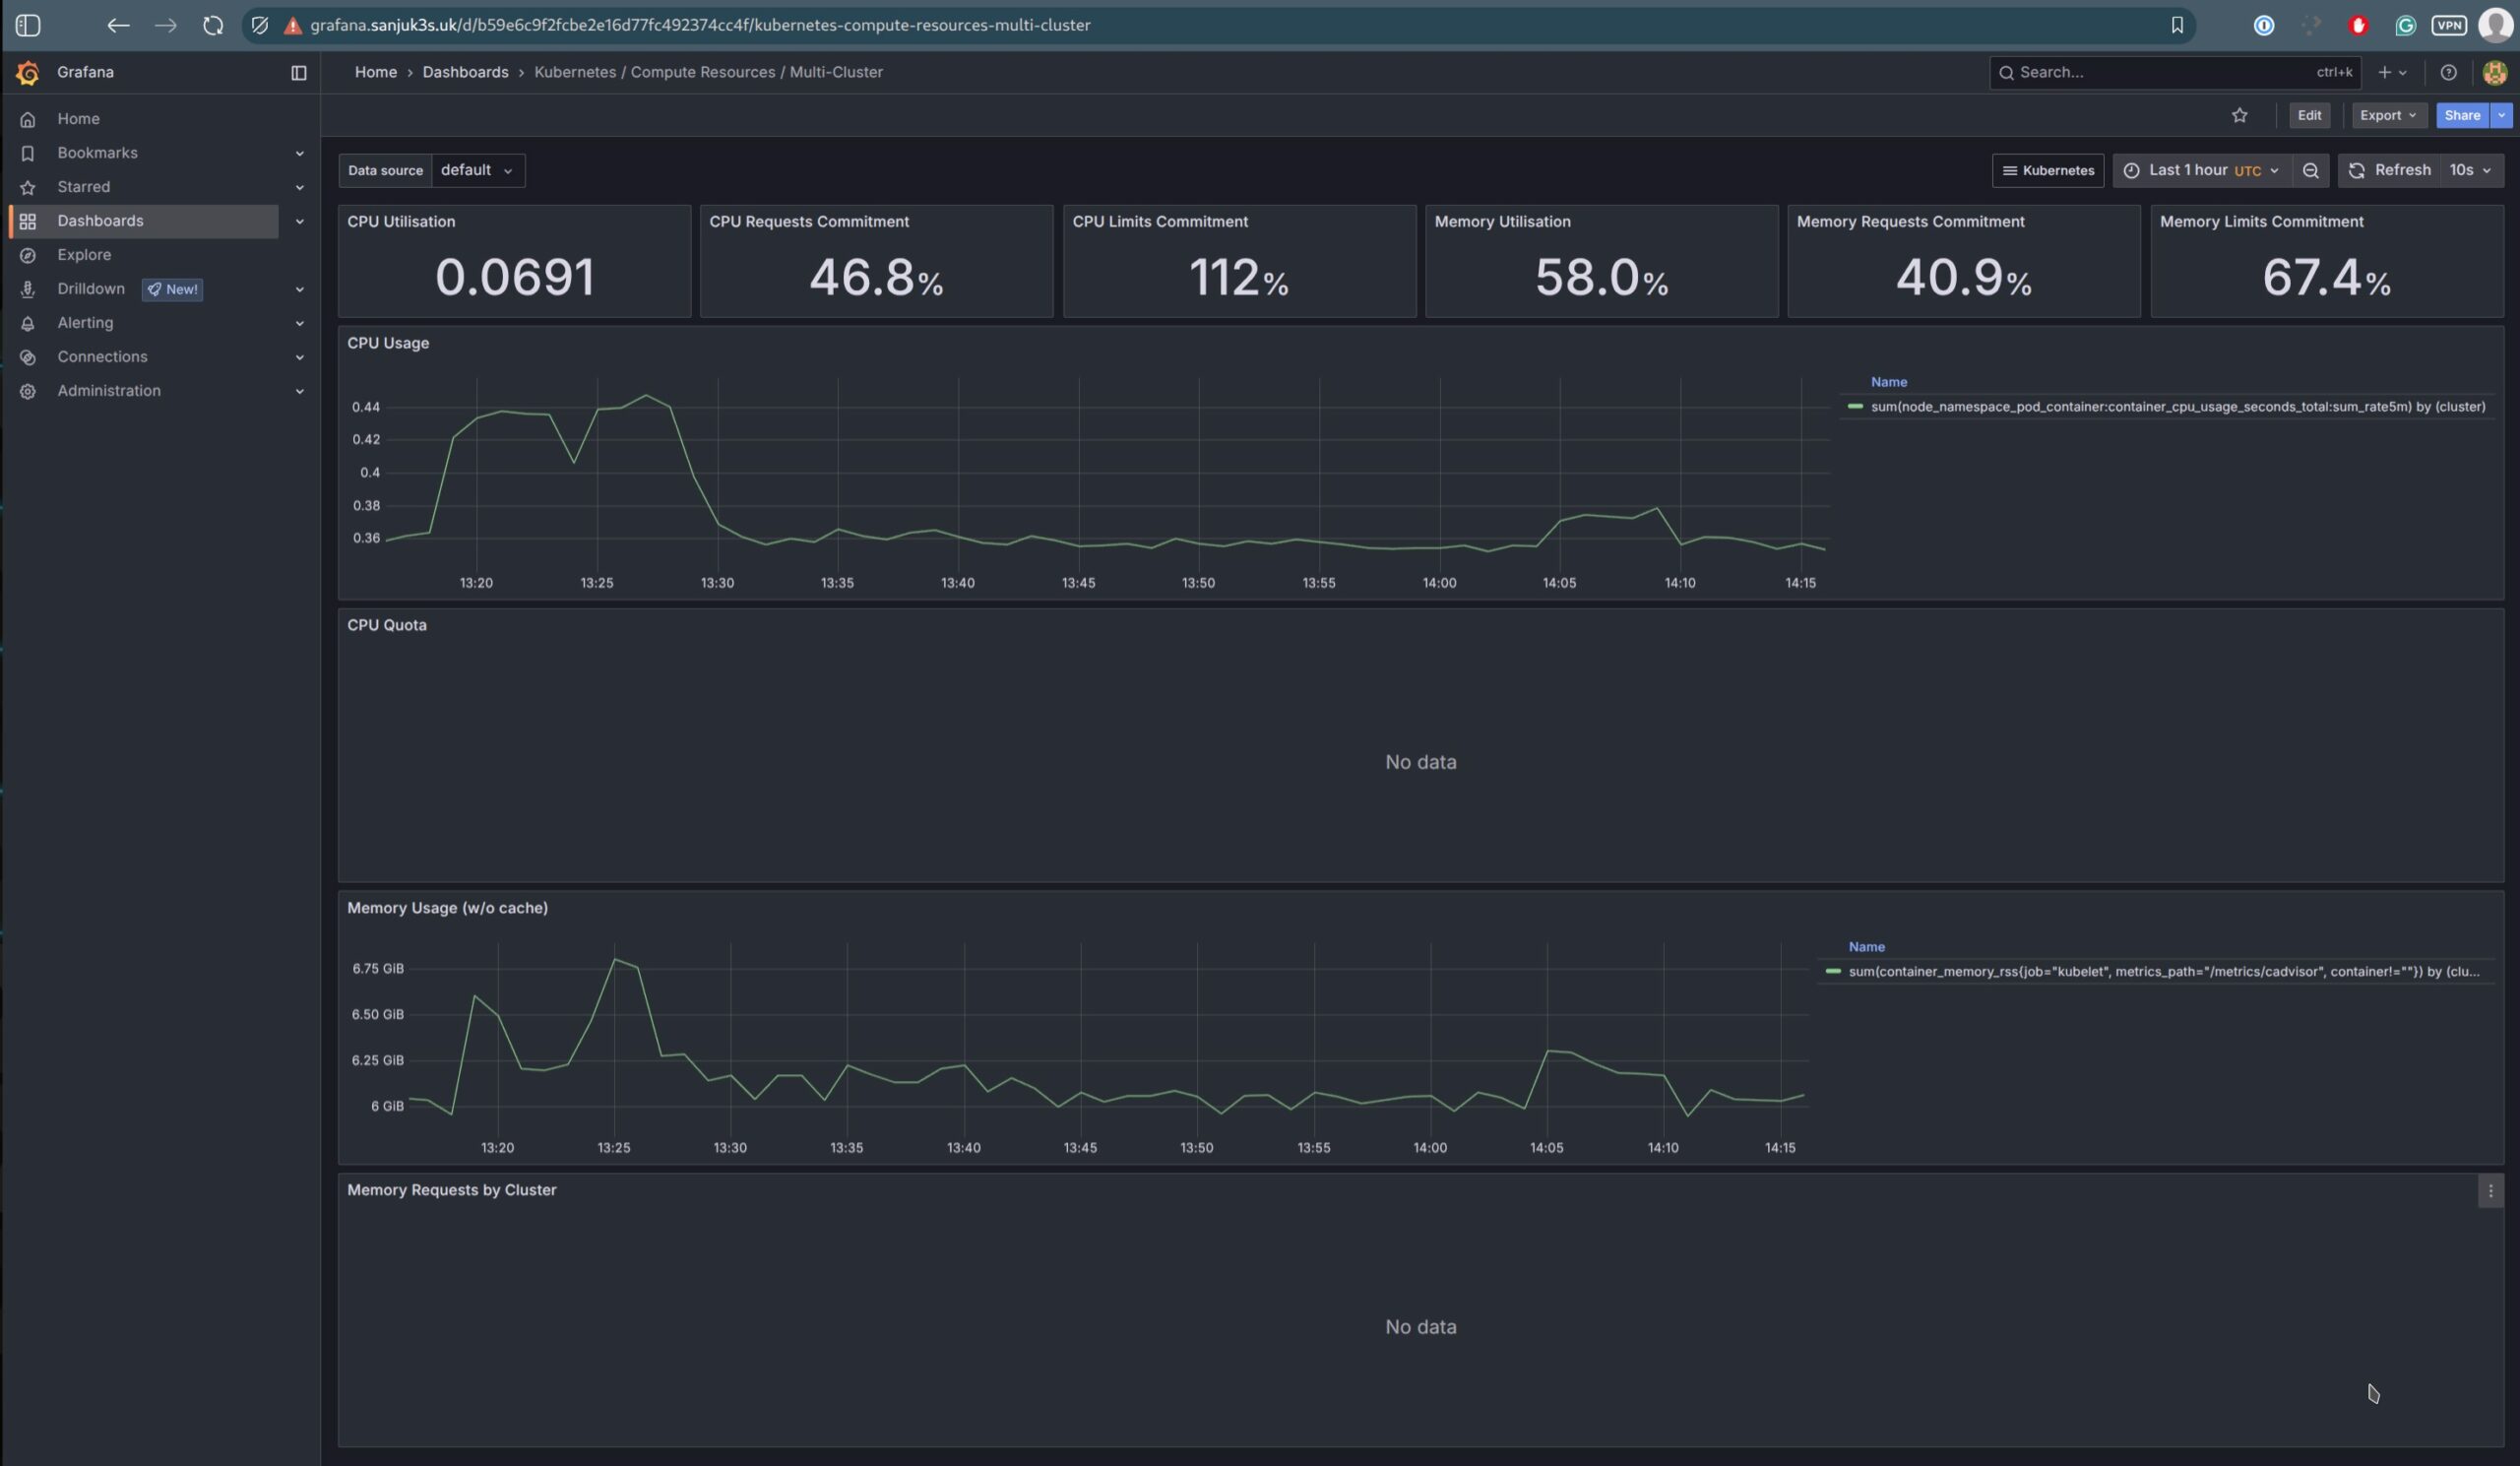
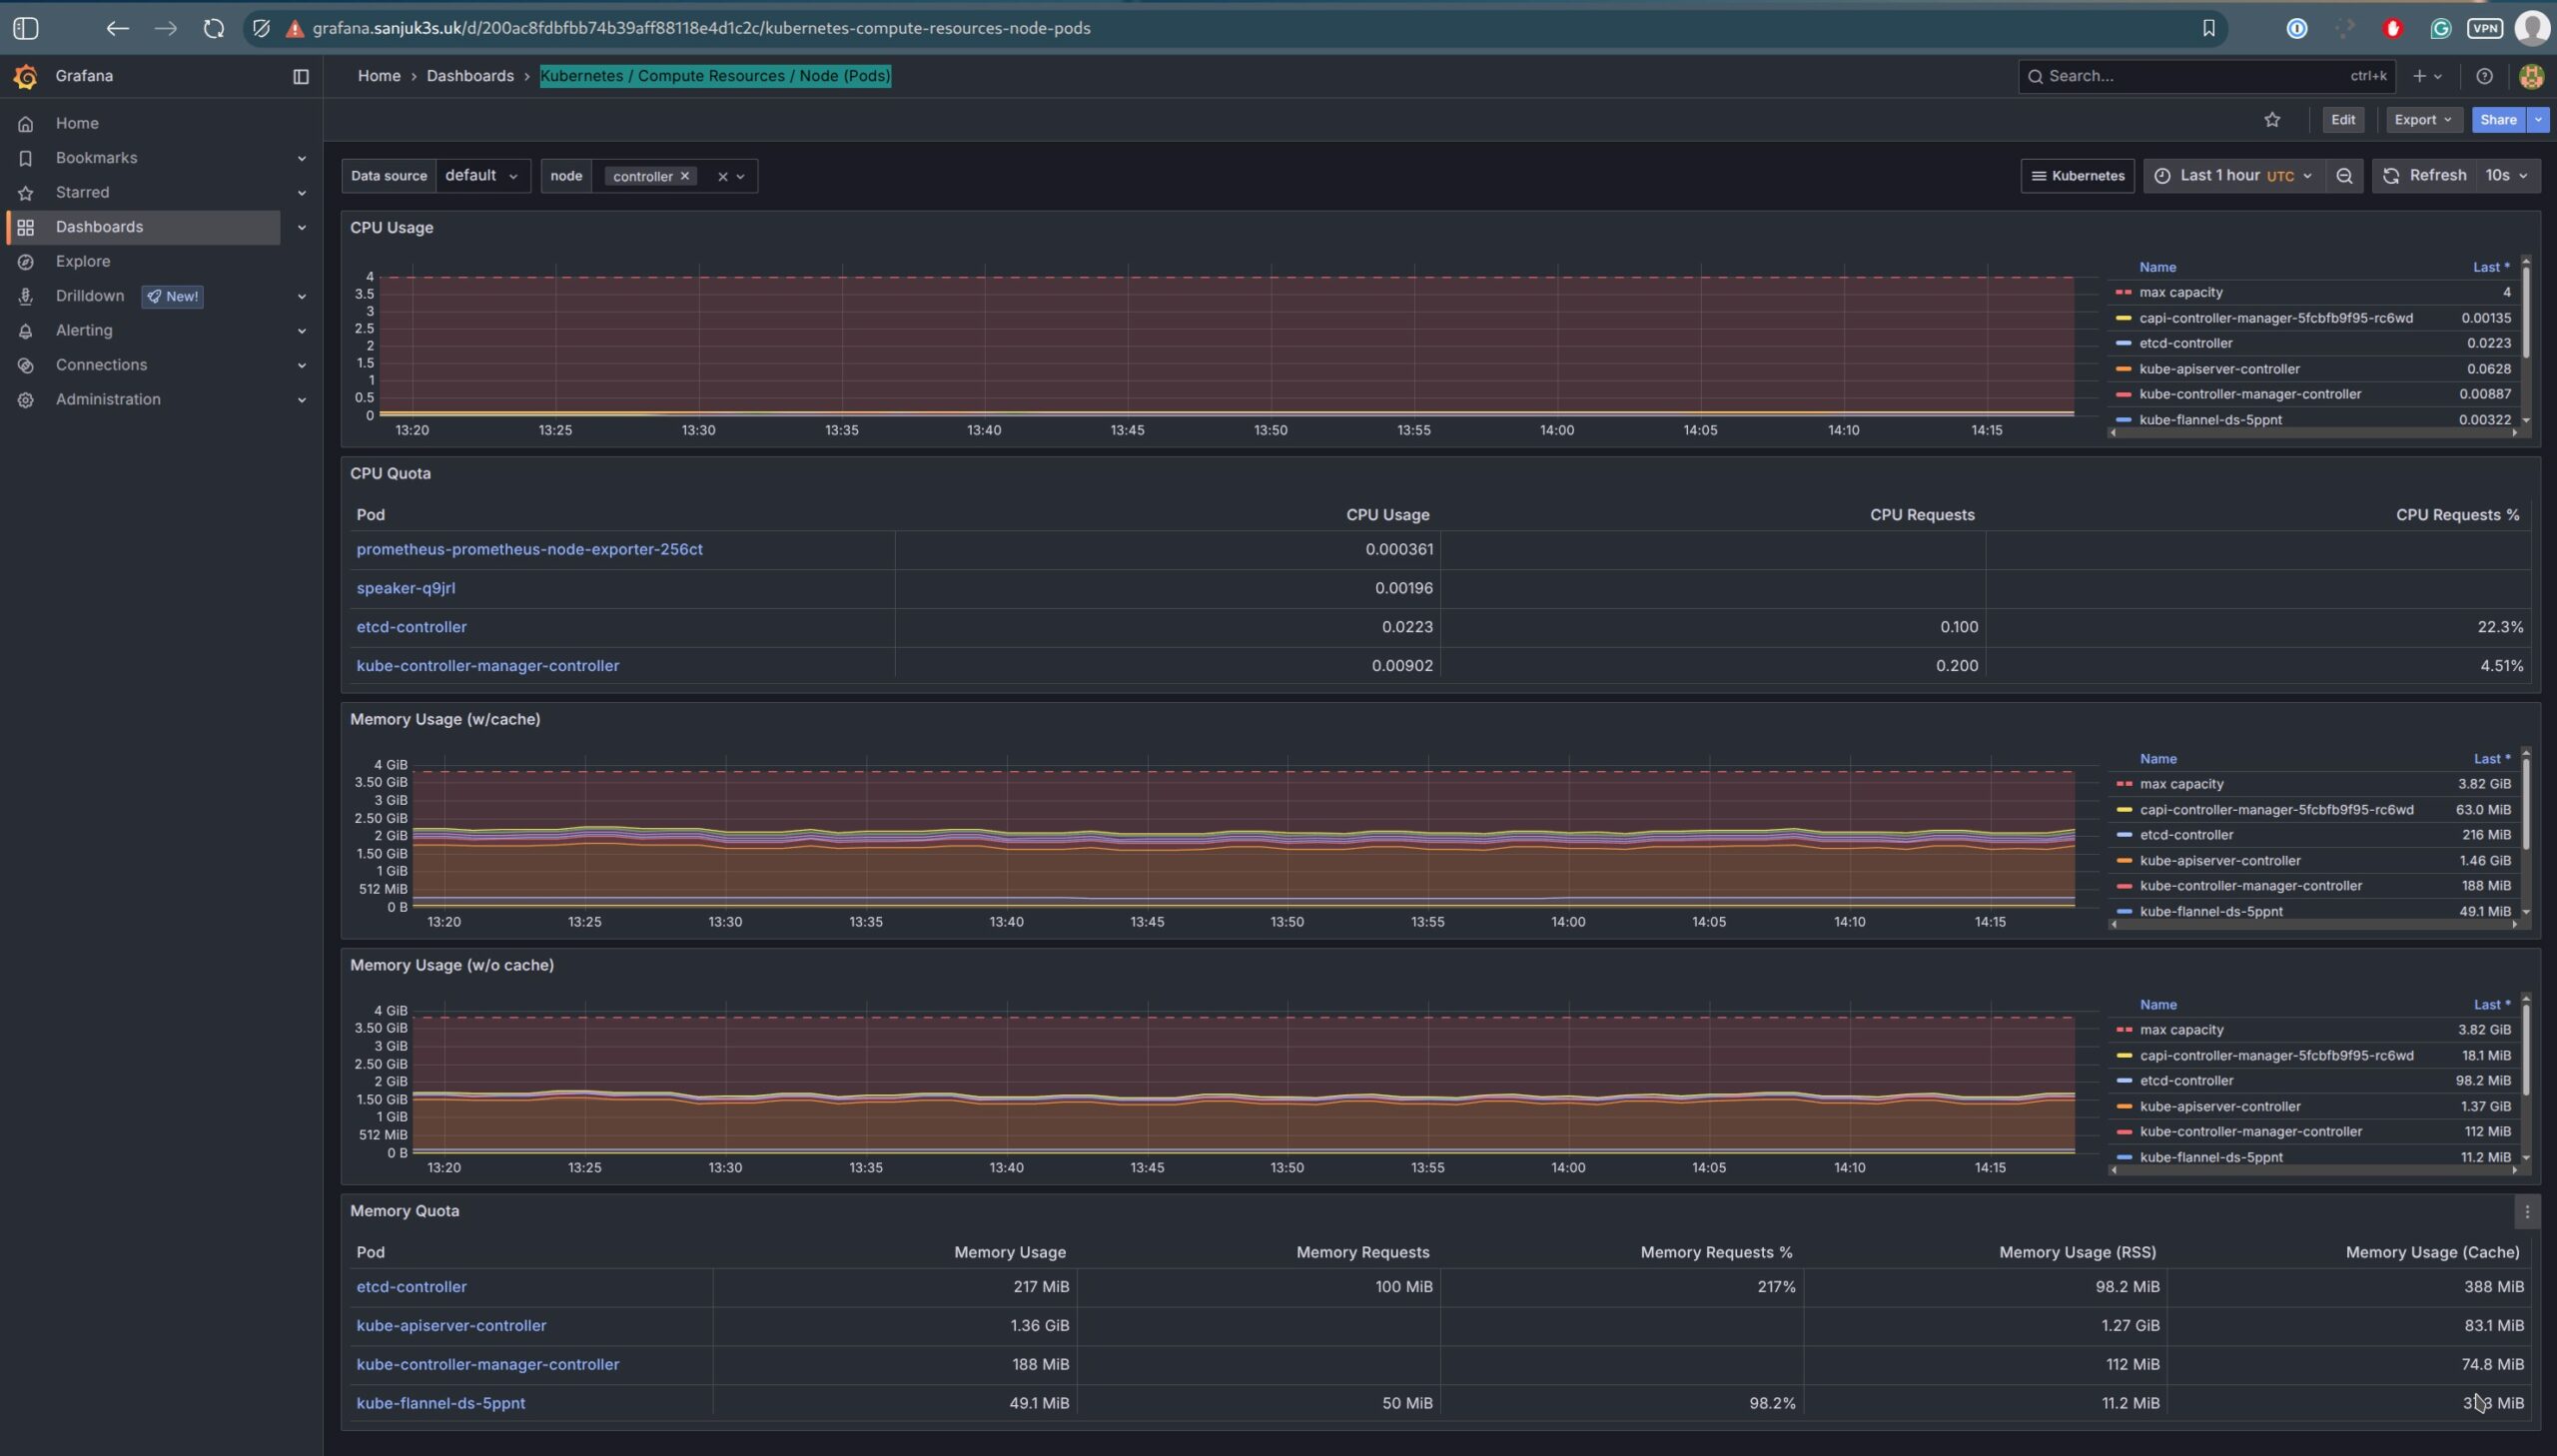
| Kubernetes Compute Resources | CPU/memory usage by cluster/namespace/pod | kubernetes-mixin |
| Kubernetes Controller Manager | Control-loop operation metrics | kubernetes-mixin |
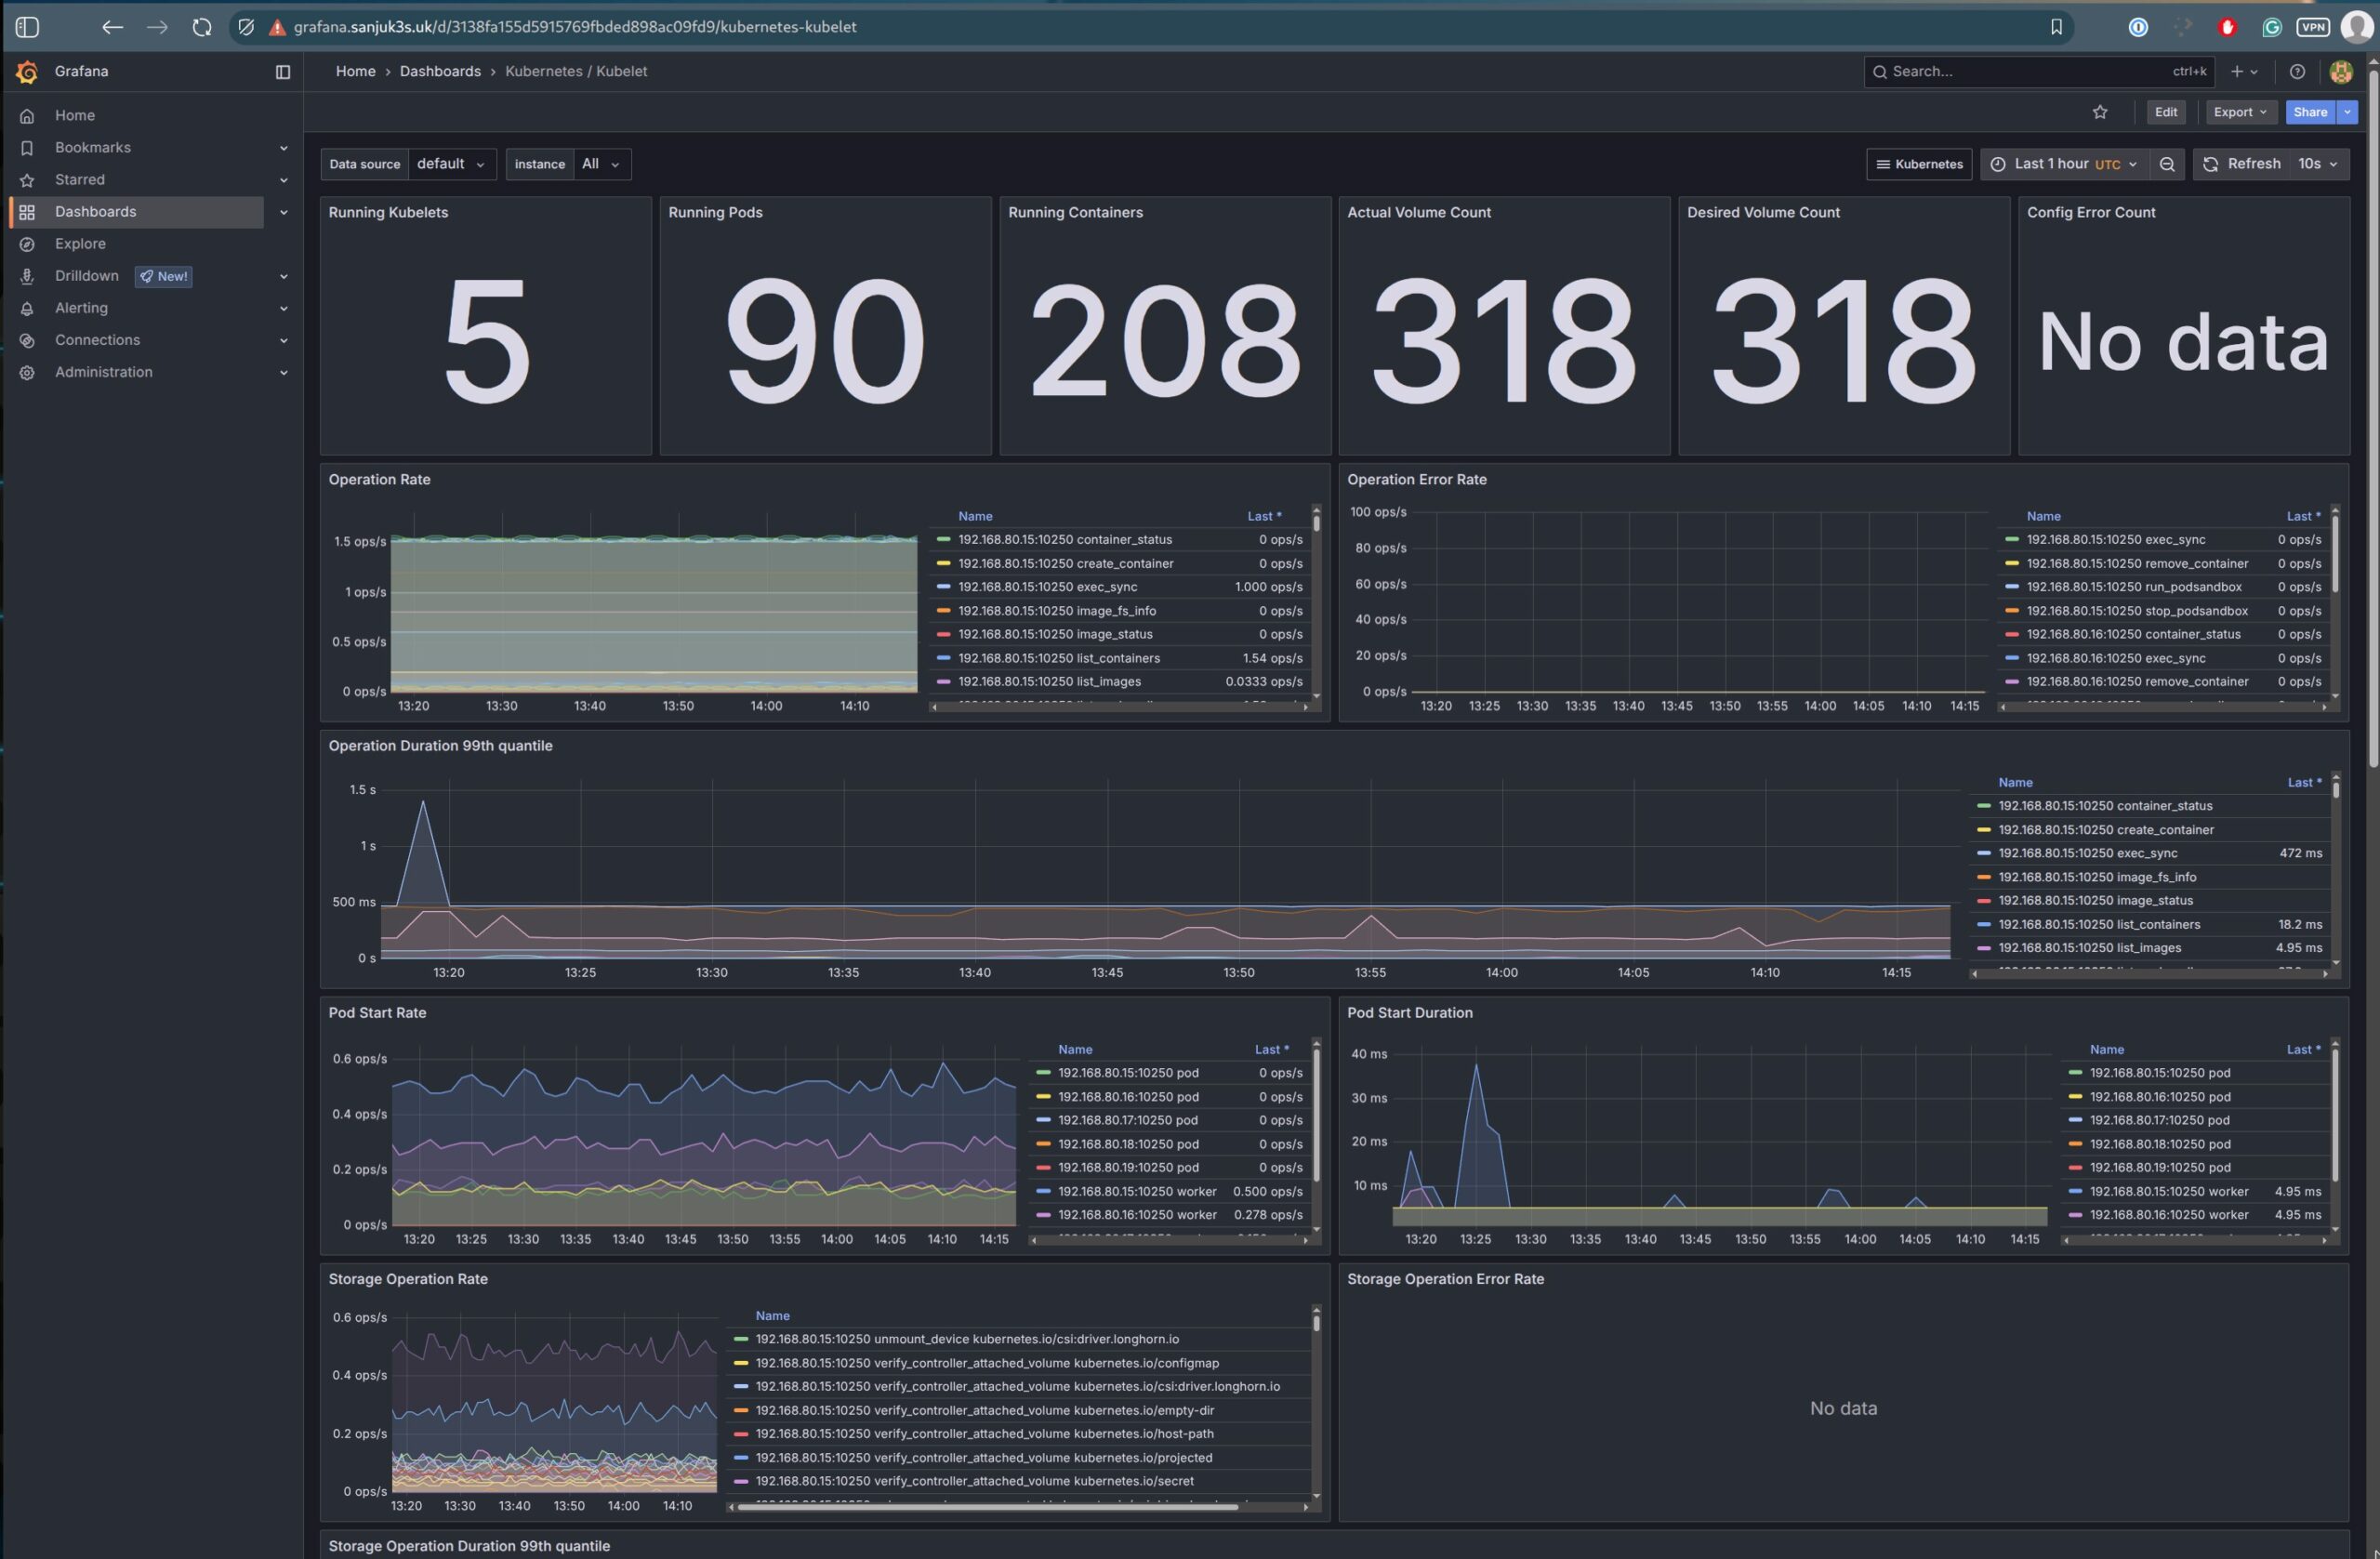
| Kubernetes Kubelet | Node health, runtime, container stats (includes cAdvisor) | kubernetes-mixin |
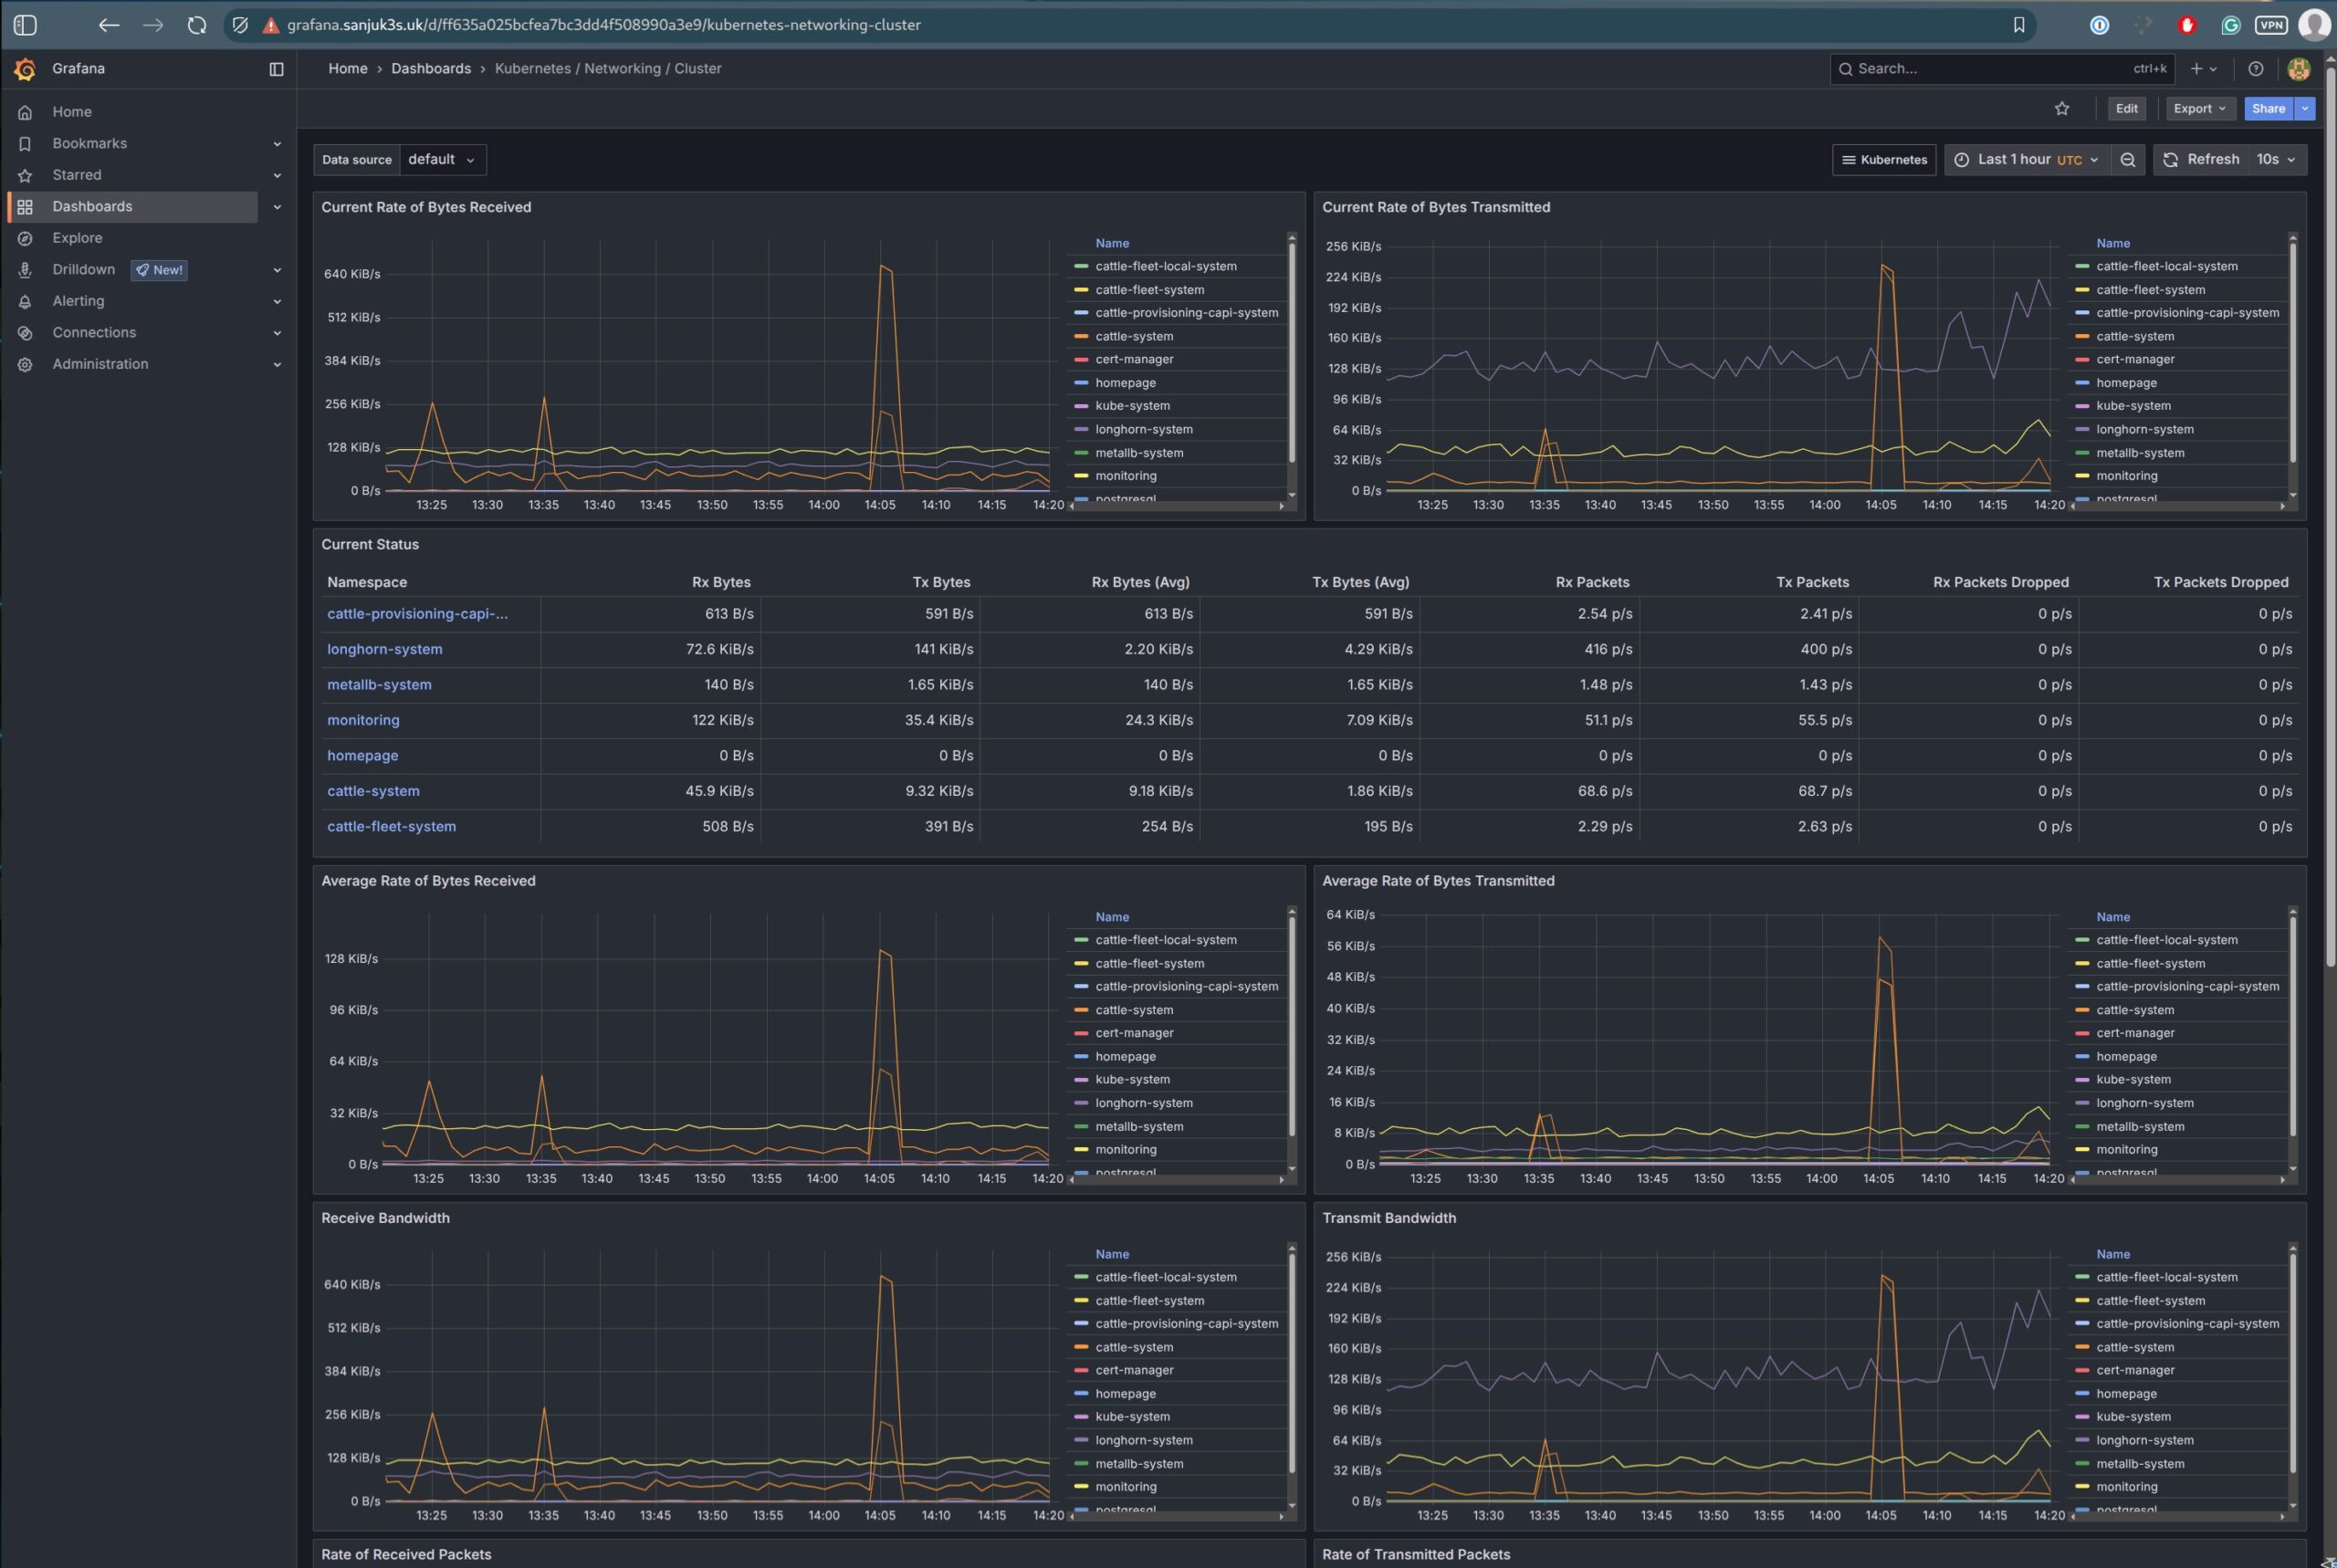
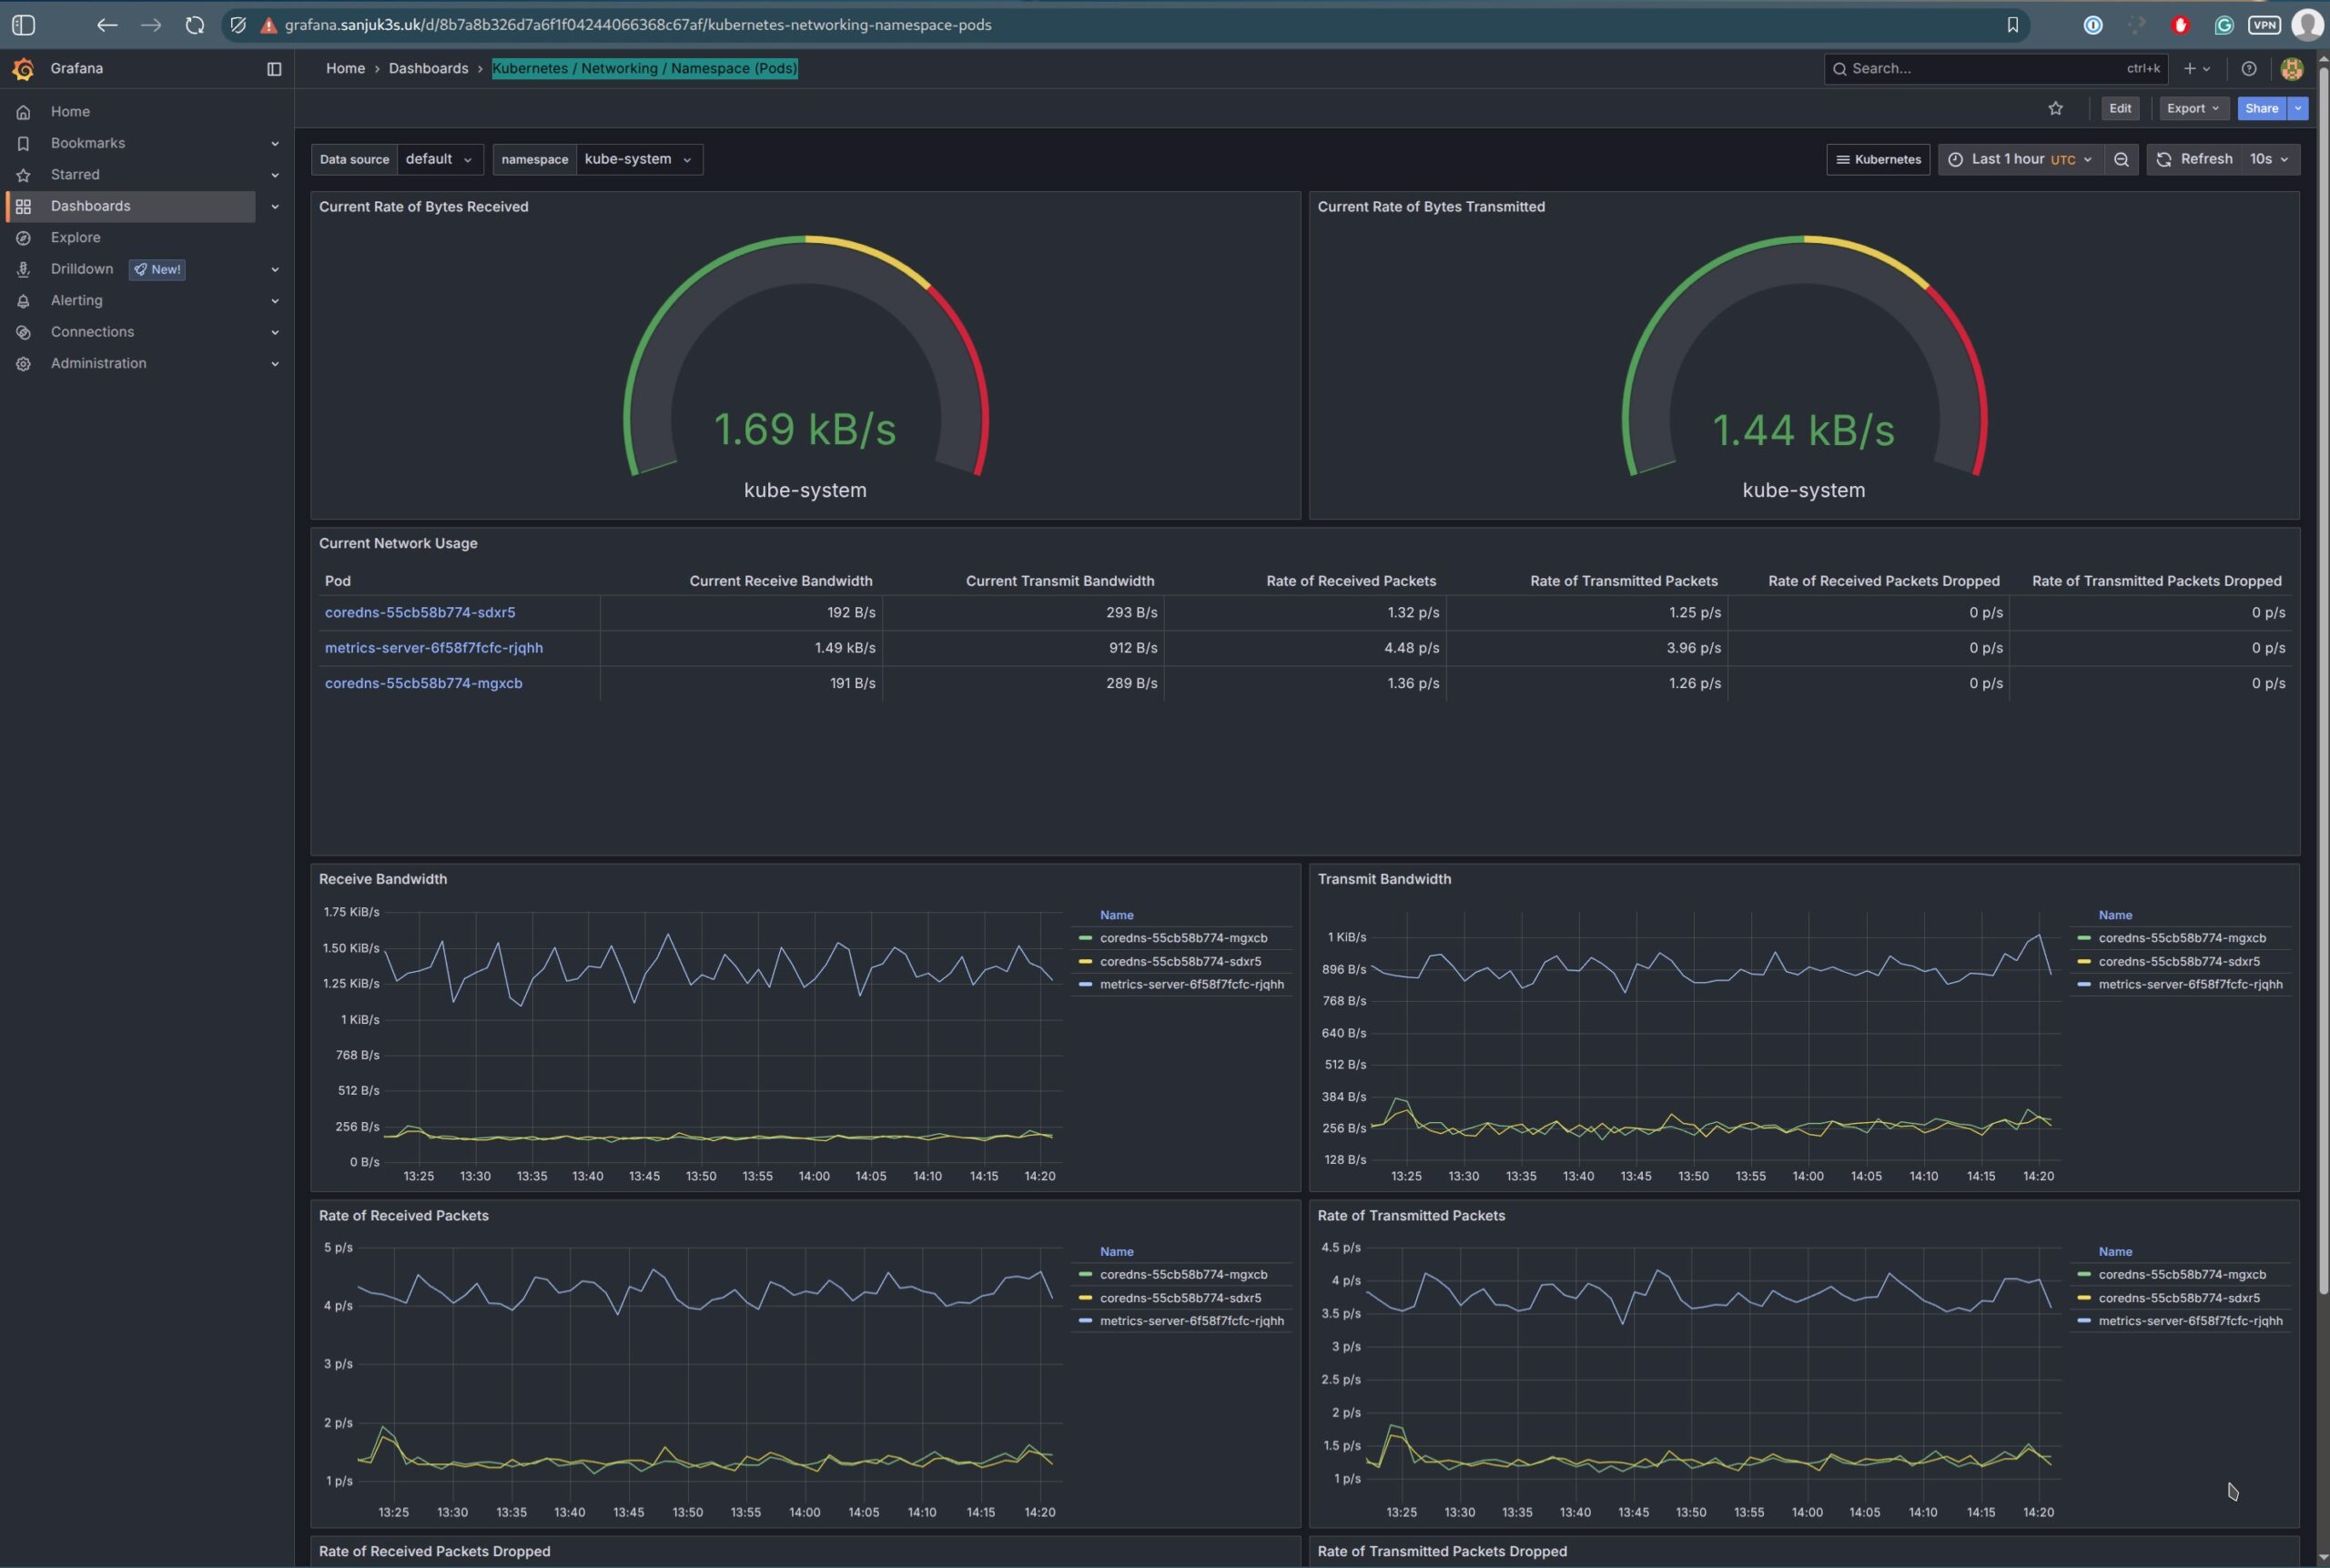
| Kubernetes Networking | Pod and workload traffic | kubernetes-mixin |
| Kubernetes Persistent Volumes | PVC capacity, usage | kubernetes-mixin |
| Kubernetes Proxy | kube-proxy metrics | kubernetes-mixin |
| Kubernetes Scheduler | Scheduling latency, performance | kubernetes-mixin |
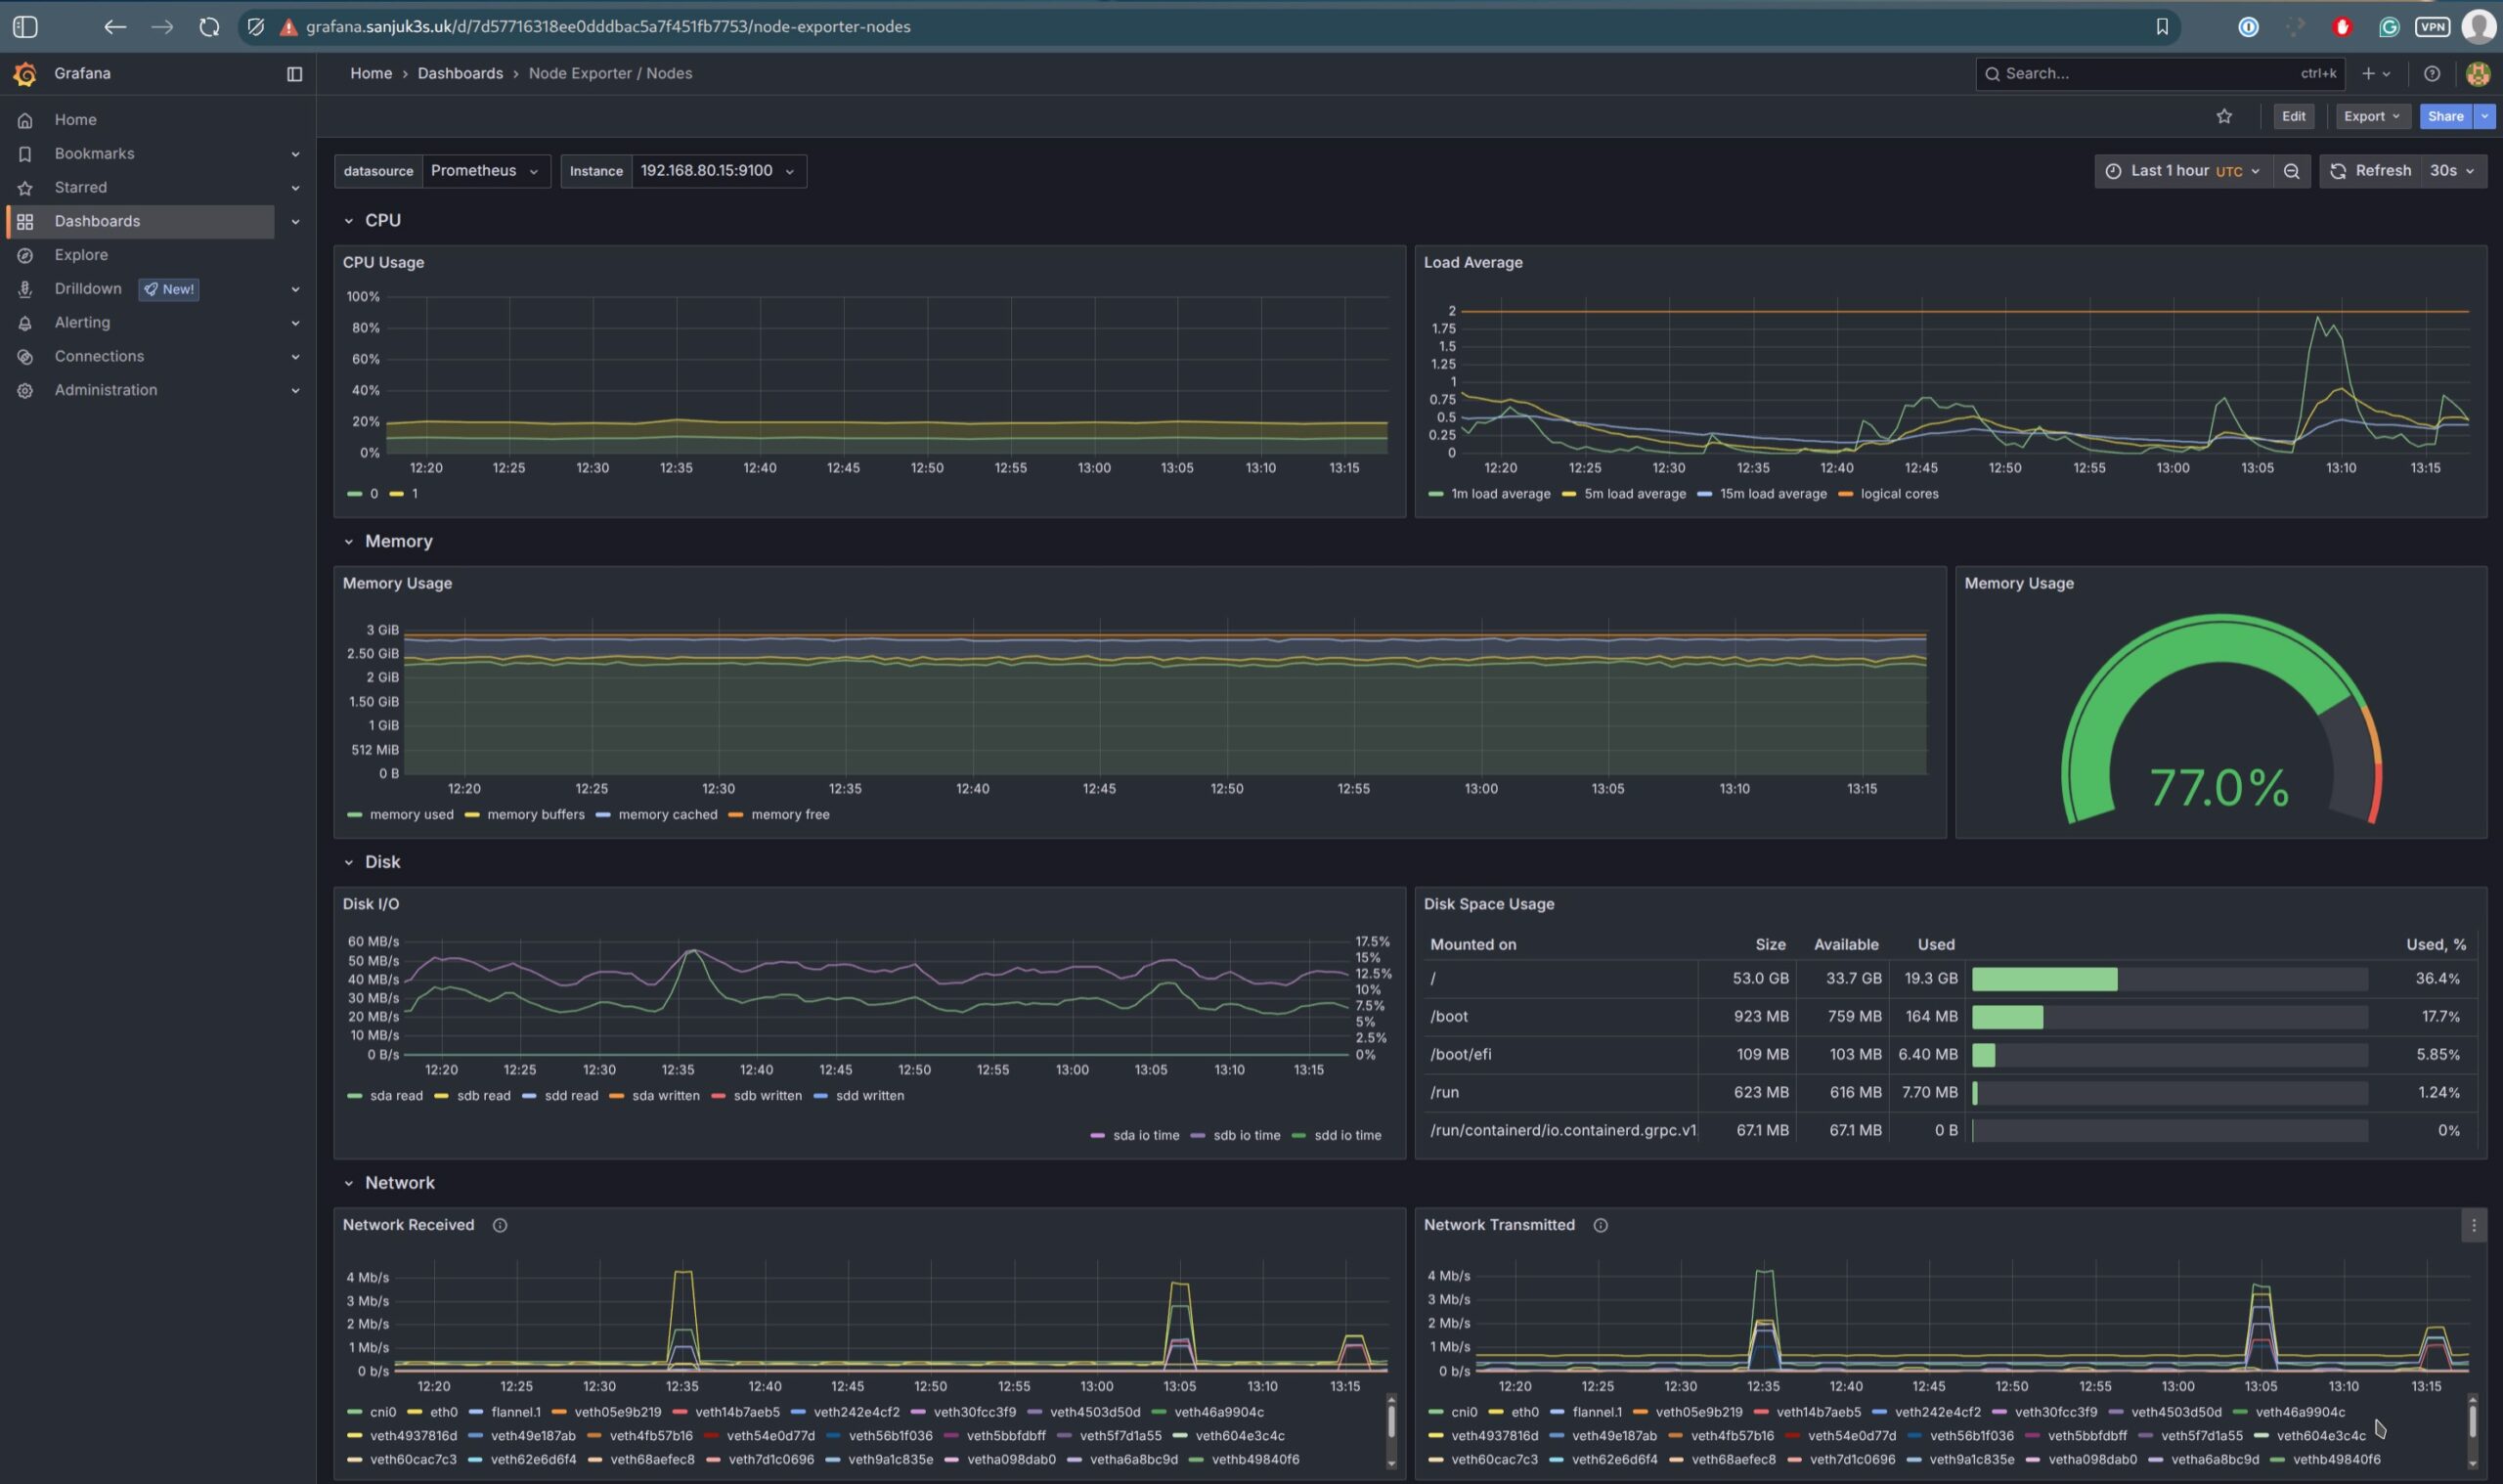
| Node Exporter (All) | Host-level CPU, mem, disk | node-exporter-mixin |
| Prometheus Overview | Prometheus performance and TSDB status | Built-in |
Helm Installation: kube-prometheus-stack
Add the Helm Repo
helm repo add prometheus-community https://prometheus-community.github.io/helm-charts
helm repo updateCreate a Namespace
kubectl create namespace monitoringInstall the chart using your custom values file
Assuming your `prometheus-values.yaml` file is ready:helm install kube-prometheus-stack prometheus-community/kube-prometheus-stack \
--namespace monitoring \
--values prometheus-values.yamlTo upgrade the release later:
helm upgrade kube-prometheus-stack prometheus-community/kube-prometheus-stack \
  --namespace monitoring \
--values prometheus-values.yamlComplete YAML Manifests with Explanations
grafana-certificate.yaml – A cert-manager Certificate resource to issue a TLS certificate for Grafana.
---
apiVersion: cert-manager.io/v1
kind: Certificate
metadata:
  name: grafana-tls
  namespace: monitoring
spec:
  secretName: traefik-tls
  commonName: grafana.example.uk
  dnsNames:
    - grafana.example.uk
  issuerRef:
    name: cloudflare
    kind: ClusterIssuer
  duration: 2160h
renewBefore: 168hgrafana-ingress.yaml – Defines an Ingress route for Grafana with TLS termination using the above certificate.
---
apiVersion: traefik.io/v1alpha1
kind: IngressRoute
metadata:
  name: grafana
  namespace: monitoring
spec:
  entryPoints:
    - websecure
  routes:
    - match: Host(`grafana.example.uk`)
      kind: Rule
      services:
        - name: prometheus-grafana
          namespace: monitoring
          port: 80
      #middlewares:
        #- name: longhorn-auth   # Remove if not using auth
  tls:
secretName: traefik-tlsprometheus-certificate.yaml – A cert-manager Certificate resource that provisions a TLS certificate for Prometheus using a ClusterIssuer (like Let’s Encrypt).
---
apiVersion: cert-manager.io/v1
kind: Certificate
metadata:
  name: prometheus-tls
  namespace: monitoring
spec:
  secretName: traefik-tls
  commonName: prometheus.example.uk
  dnsNames:
    - prometheus.example.uk
  issuerRef:
    name: cloudflare
    kind: ClusterIssuer
  duration: 2160h
renewBefore: 168hprometheus-ingress.yaml – Creates an Ingress route for Prometheus, with HTTPS and basic auth enabled via Traefik and cert-manager.
---
apiVersion: traefik.io/v1alpha1
kind: IngressRoute
metadata:
  name: prometheus
  namespace: monitoring
spec:
  entryPoints:
    - websecure
  routes:
    - match: Host(`prometheus.example.uk`)
      kind: Rule
      services:
        - name: prometheus-kube-prometheus-prometheus
          namespace: monitoring
          port: 9090
      middlewares:
        - name: prometheus-auth   # Remove if not using auth
  tls:
secretName: traefik-tlsprometheus-middleware.yaml – Defines a Traefik Middleware resource that references the above secret and applies basic authentication to the Prometheus Ingress.
---
apiVersion: traefik.io/v1alpha1
kind: Middleware
metadata:
  name: prometheus-auth
  namespace: monitoring
spec:
  basicAuth:
secret: prometheus-authprometheus-secret.yaml – Stores basic authentication credentials used by Traefik middleware to protect access to the Prometheus dashboard.
---
apiVersion: v1
kind: Secret
metadata:
  name: prometheus-auth
  namespace: monitoring
type: Opaque
data:
users: c2Fuamh1bWEJDA1JDJxaVlxRUpjUi5Ed #Base64 encodedprometheus-values.yaml – This Helm values file customises the Prometheus, Grafana, and Alertmanager setup. It enables Ingress, configures TLS with cert-manager, and links to authentication middleware.
alertmanager:
  persistence:
    accessModes:
    - ReadWriteMany
    allowVolumeExpansion: true
    annotations: {}
    enabled: true
    existingClaim: ""
    mountPath: /alertmanager
    reclaimPolicy: Retain
    size: 10Gi
    storageClass: longhorn-rwx
    subPath: ""
    volumeBindingMode: Immediate
    volumeMode: Filesystem
    volumeName: alertmanager-volume
  resources:
    limits:
      memory: 1024Mi
    requests:
      cpu: 1000m
      memory: 1024Mi
grafana:
  persistence:
    accessModes:
    - ReadWriteMany
    allowVolumeExpansion: true
    annotations: {}
    enabled: true
    existingClaim: ""
    mountPath: /var/lib/grafana
    reclaimPolicy: Retain
    size: 5Gi
    storageClass: longhorn-rwx
    subPath: ""
    volumeBindingMode: Immediate
    volumeMode: Filesystem
    volumeName: grafana-volume
  resources:
    limits:
      memory: 1024Mi
    requests:
      cpu: 1000m
      memory: 1024Mi
  env:
    GF_AUTH_API_ENABLED: "true"

kubeControllerManager:
  enabled: true
  service:
    enabled: true
    port: 10257
    scheme: https
    targetPort: 10257
    tlsConfig:
      caFile: /etc/prometheus/secrets/prometheus-client-tls/ca.crt
      certFile: /etc/prometheus/secrets/prometheus-client-tls/tls.crt
      insecureSkipVerify: true
      keyFile: /etc/prometheus/secrets/prometheus-client-tls/tls.key
kubeEtcd:
  enabled: true
  service:
    enabled: true
    port: 2381
    scheme: https
    targetPort: 2381
    tlsConfig:
      caFile: /etc/prometheus/secrets/prometheus-client-tls/ca.crt
      certFile: /etc/prometheus/secrets/prometheus-client-tls/tls.crt
      insecureSkipVerify: true
      keyFile: /etc/prometheus/secrets/prometheus-client-tls/tls.key
kubeScheduler:
  enabled: true
  service:
    enabled: true
    port: 10259
    scheme: https
    targetPort: 10259
    tlsConfig:
      caFile: /etc/prometheus/secrets/prometheus-client-tls/ca.crt
      certFile: /etc/prometheus/secrets/prometheus-client-tls/tls.crt
      insecureSkipVerify: true
      keyFile: /etc/prometheus/secrets/prometheus-client-tls/tls.key
prometheus:
    secrets:
- prometheus-client-tlsalertmanager-certificate.yaml – Cert-manager certificate resource to secure Alertmanager access with HTTPS.
---
apiVersion: cert-manager.io/v1
kind: Certificate
metadata:
  name: alertmanager-tls
  namespace: monitoring
spec:
  secretName: traefik-tls
  commonName: alertmanager.example.uk
  dnsNames:
    - alertmanager.example.uk
  issuerRef:
    name: cloudflare
    kind: ClusterIssuer
  duration: 2160h
renewBefore: 168halertmanager-ingress.yaml – Exposes Alertmanager through a secure Ingress with TLS and basic authentication.
---
apiVersion: traefik.io/v1alpha1
kind: IngressRoute
metadata:
  name: alertmanager
  namespace: monitoring
spec:
  entryPoints:
    - websecure
  routes:
    - match: Host(`alertmanager.example.uk`)
      kind: Rule
      services:
        - name: prometheus-kube-prometheus-alertmanager
          namespace: monitoring
          port: 9093
      middlewares:
        - name: prometheus-auth   # Remove if not using auth
  tls:
secretName: traefik-tlsalertmanager-middleware.yaml – Defines the Middleware resource that enforces HTTP basic authentication on the Alertmanager Ingress.
---
apiVersion: traefik.io/v1alpha1
kind: Middleware
metadata:
  name: alertmanager-auth
  namespace: monitoring
spec:
  basicAuth:
secret: alertmanager-authalertmanager-secret.yaml – Stores basic authentication credentials used by Traefik middleware for Alertmanager.
---
apiVersion: v1
kind: Secret
metadata:
  name: alertmanager-auth
  namespace: monitoring
type: Opaque
data:
users: c2Fuamh1bWE6JD1JDJxaVlxRUpjU #Base64 encodedGenerating Traefik Basic Auth Credentials
To secure your Prometheus, Grafana, and Alertmanager dashboards with HTTP Basic Auth in Traefik, follow these steps:
Step 1: Generate a bcrypt password hash
Use the htpasswd utility from the apache2-utils or httpd-tools package:
htpasswd -nB adminExample output:
admin:$2y$05$0wnPWl3eXtYHixn.6OSNkOR3bEhA5YUw7BBDJvDAlJgkRM8B81qfCStep 2: Base64-encode the result
echo 'admin:$2y$05$0wnPWl3eXtYHixn.6OSNkOR3bEhA5YUw7BBDJvDAlJgkRM8B81qfC' | base64Output:
YWRtaW46JDJ5JDA1JDB3blB... #(truncated)Step 3: Create a Kubernetes Secret
---
apiVersion: v1
kind: Secret
metadata:
  name: my-auth-secret
  namespace: monitoring
type: Opaque
data:
users: <your base64-encoded value here>Now you can reference this secret in a Traefik Middleware for basic authentication.
Kube-Prometheus Stack Setup with Secure Metrics Scraping
In the following section, I will cover a few critical pieces of information regarding scraping data securely, deploying and configuring the kube-prometheus-stack with TLS authentication, node-level metrics scraping, and service monitoring in a Kubernetes cluster. Here you can read the article