

Context & Goals
In my recent articles, I shared how I set up a multi-node Kubernetes cluster on Proxmox VE with one control plane node and four worker nodes. I also kept running several Docker-based services alongside my Kubernetes workloads.
As my homelab grew, I tried out more services and workflows. For example, I wanted to run a Git service in Kubernetes. I tested GitLab, but found it used too many resources for my setup. So, I chose Gitea and ran it on a separate Docker VM that better fits my hardware.
Adding more services to Kubernetes, Docker, and other platforms made it harder to keep track of everything. Even though I had Grafana and Prometheus set up, I still didn’t have one place to find all my services, check their status, and access them easily.
That’s why I decided to build a single operations dashboard.
Dashboard for Self-Hosted Systems
In production environments, visibility and accessibility are critical. Without a central dashboard, managing multiple services quickly turns into juggling IP addresses, bookmarks, and domain names.
For a homelab that mirrors real-world infrastructure patterns, a dashboard isn’t just convenience; it’s an operational necessity. It reduces cognitive load, shortens troubleshooting time, and encourages better system hygiene.
Platform Overview
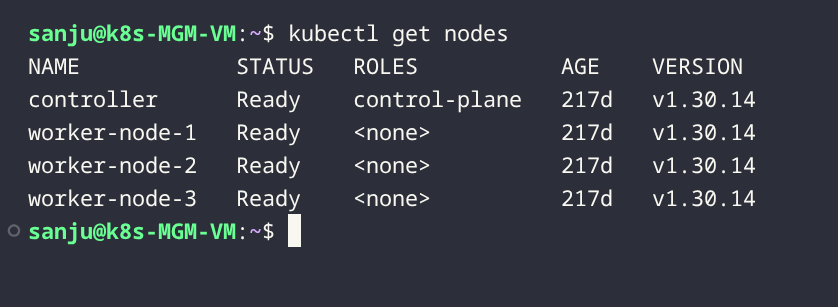
Kubernetes Cluster
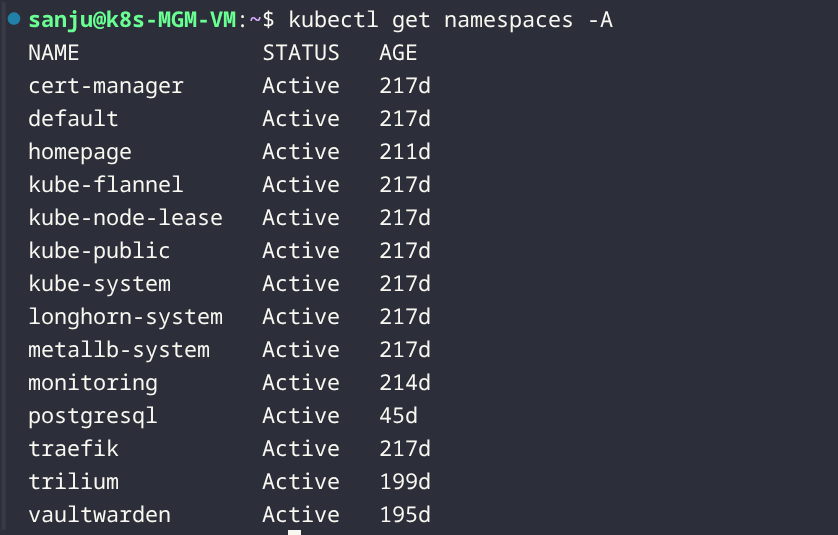
The Kubernetes cluster runs on Proxmox VE and hosts the majority of application workloads and observability tooling.
Ingress, Storage, and Monitoring
- Ingress: Traefik, with MetalLB providing load-balanced external access
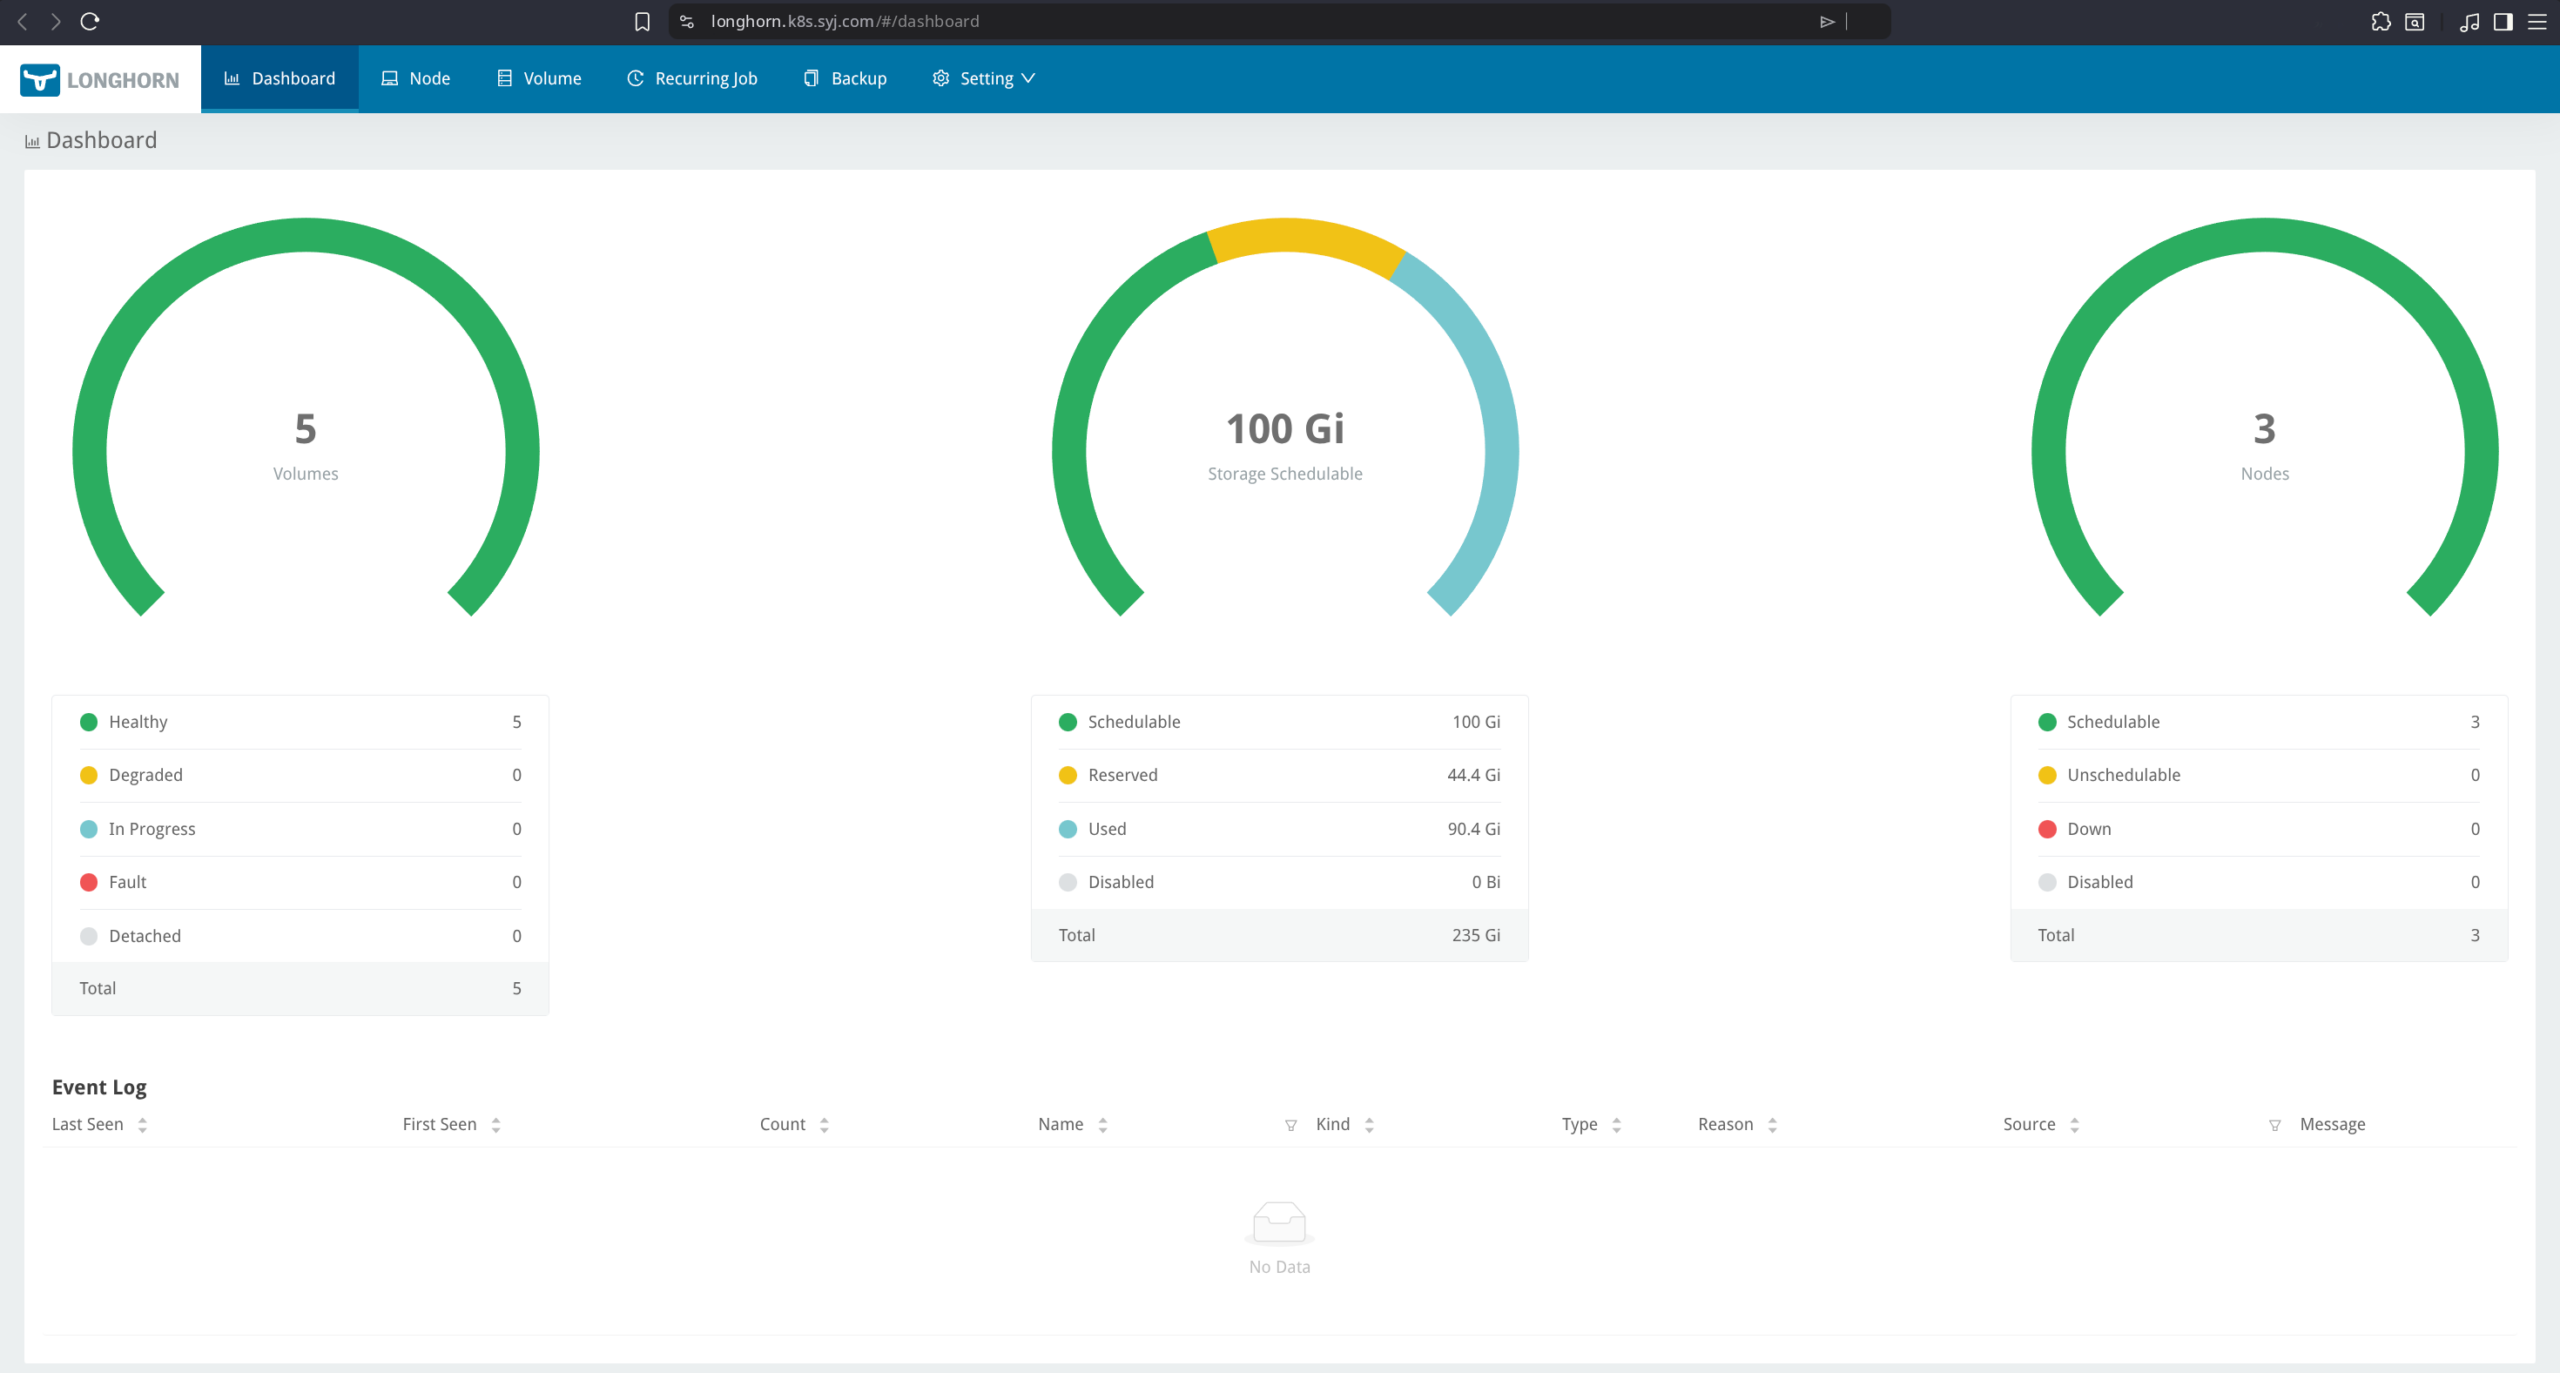
- Storage: Longhorn with a default replica count of two
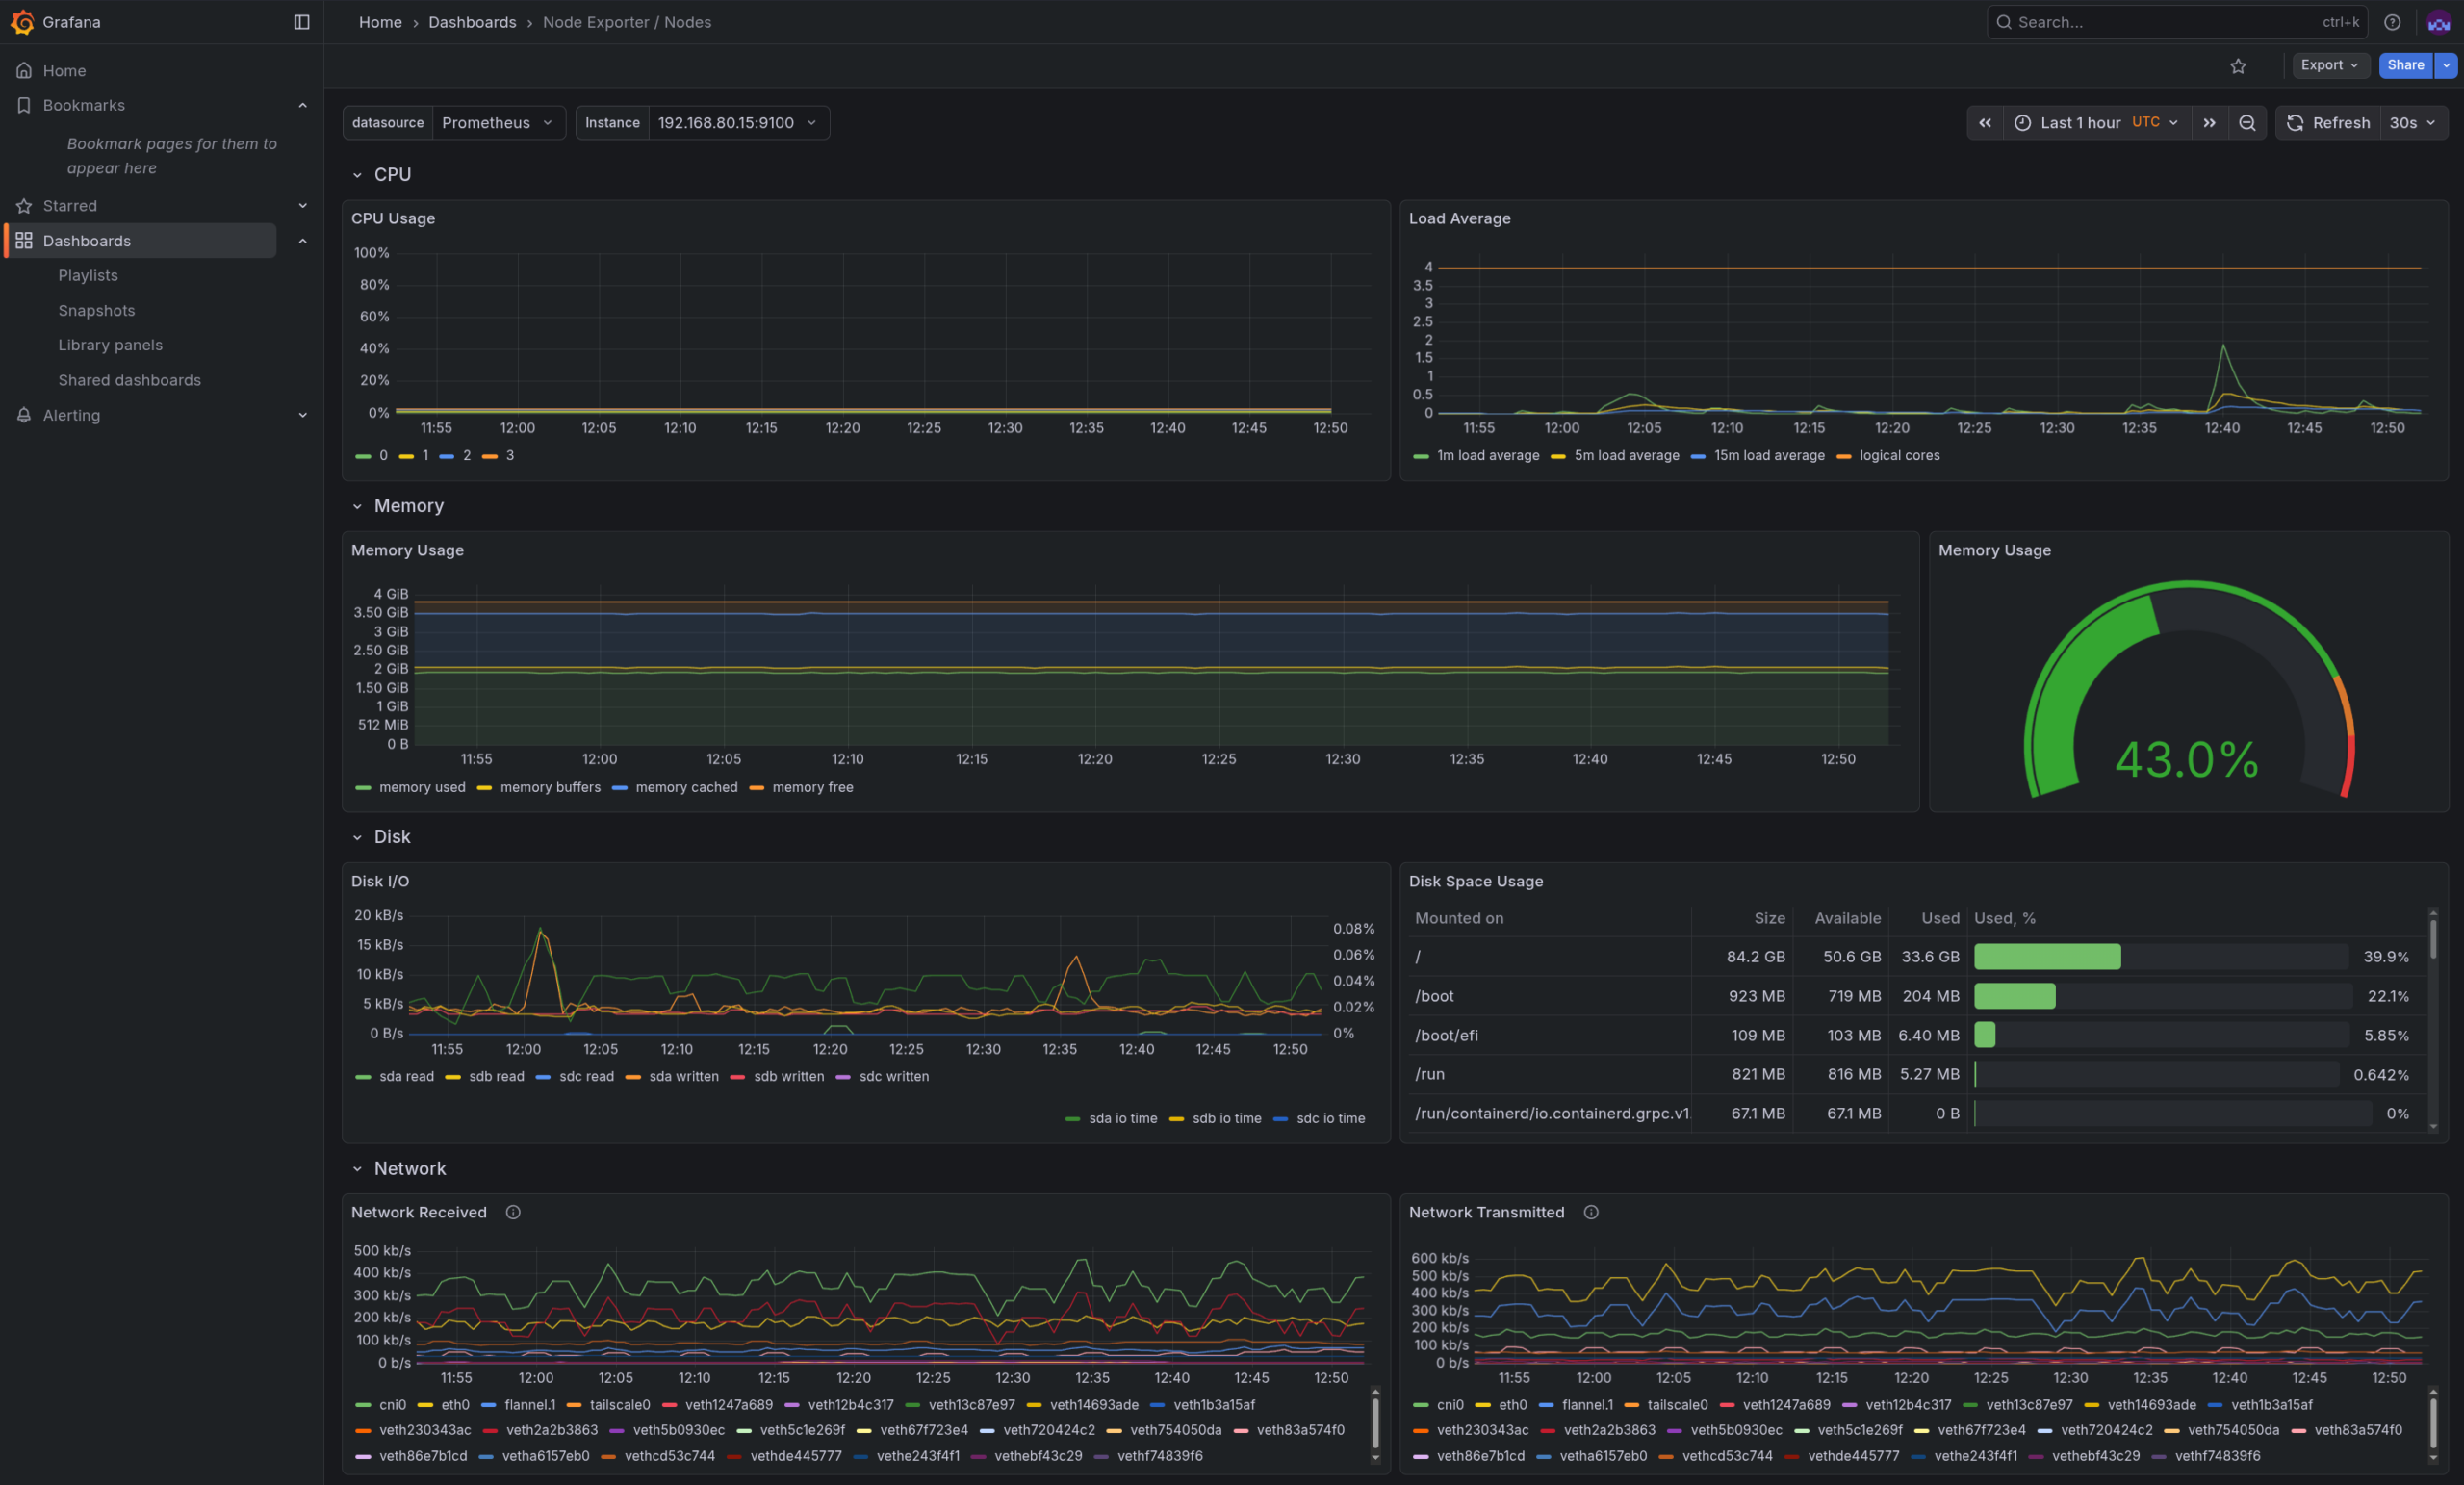
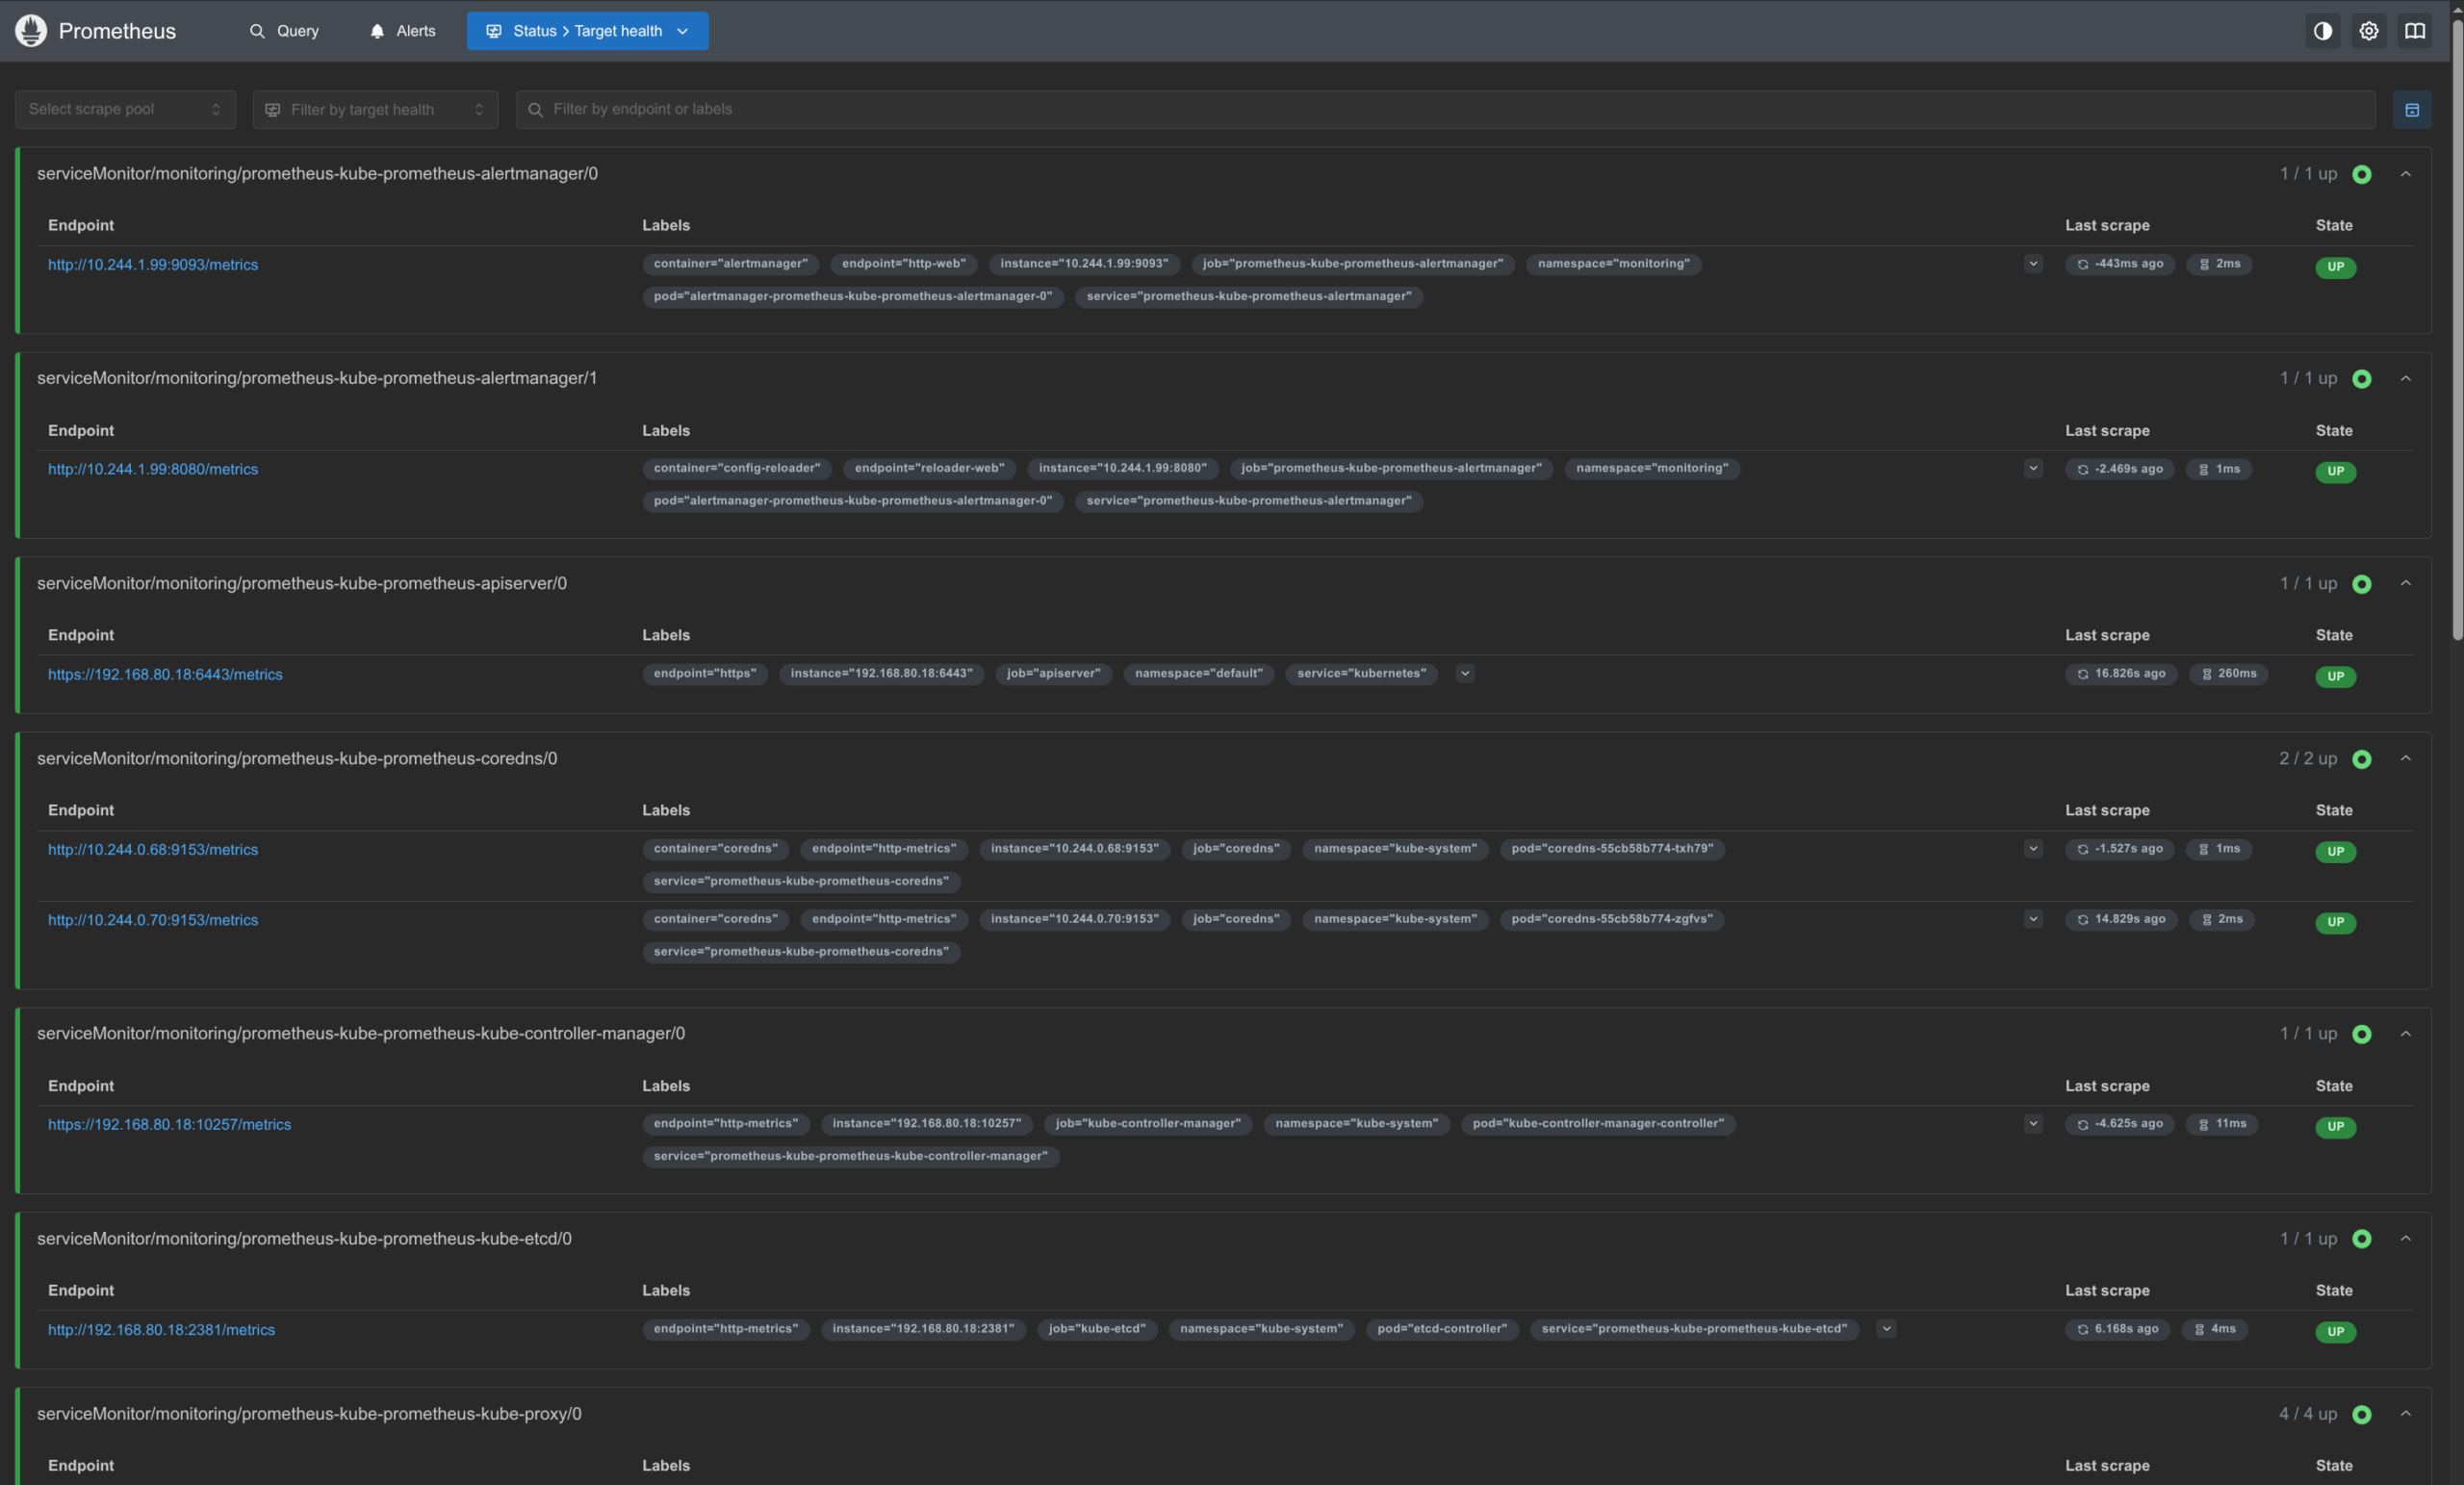
- Monitoring: Prometheus for metrics collection and Grafana for visualisation
Network Segmentation
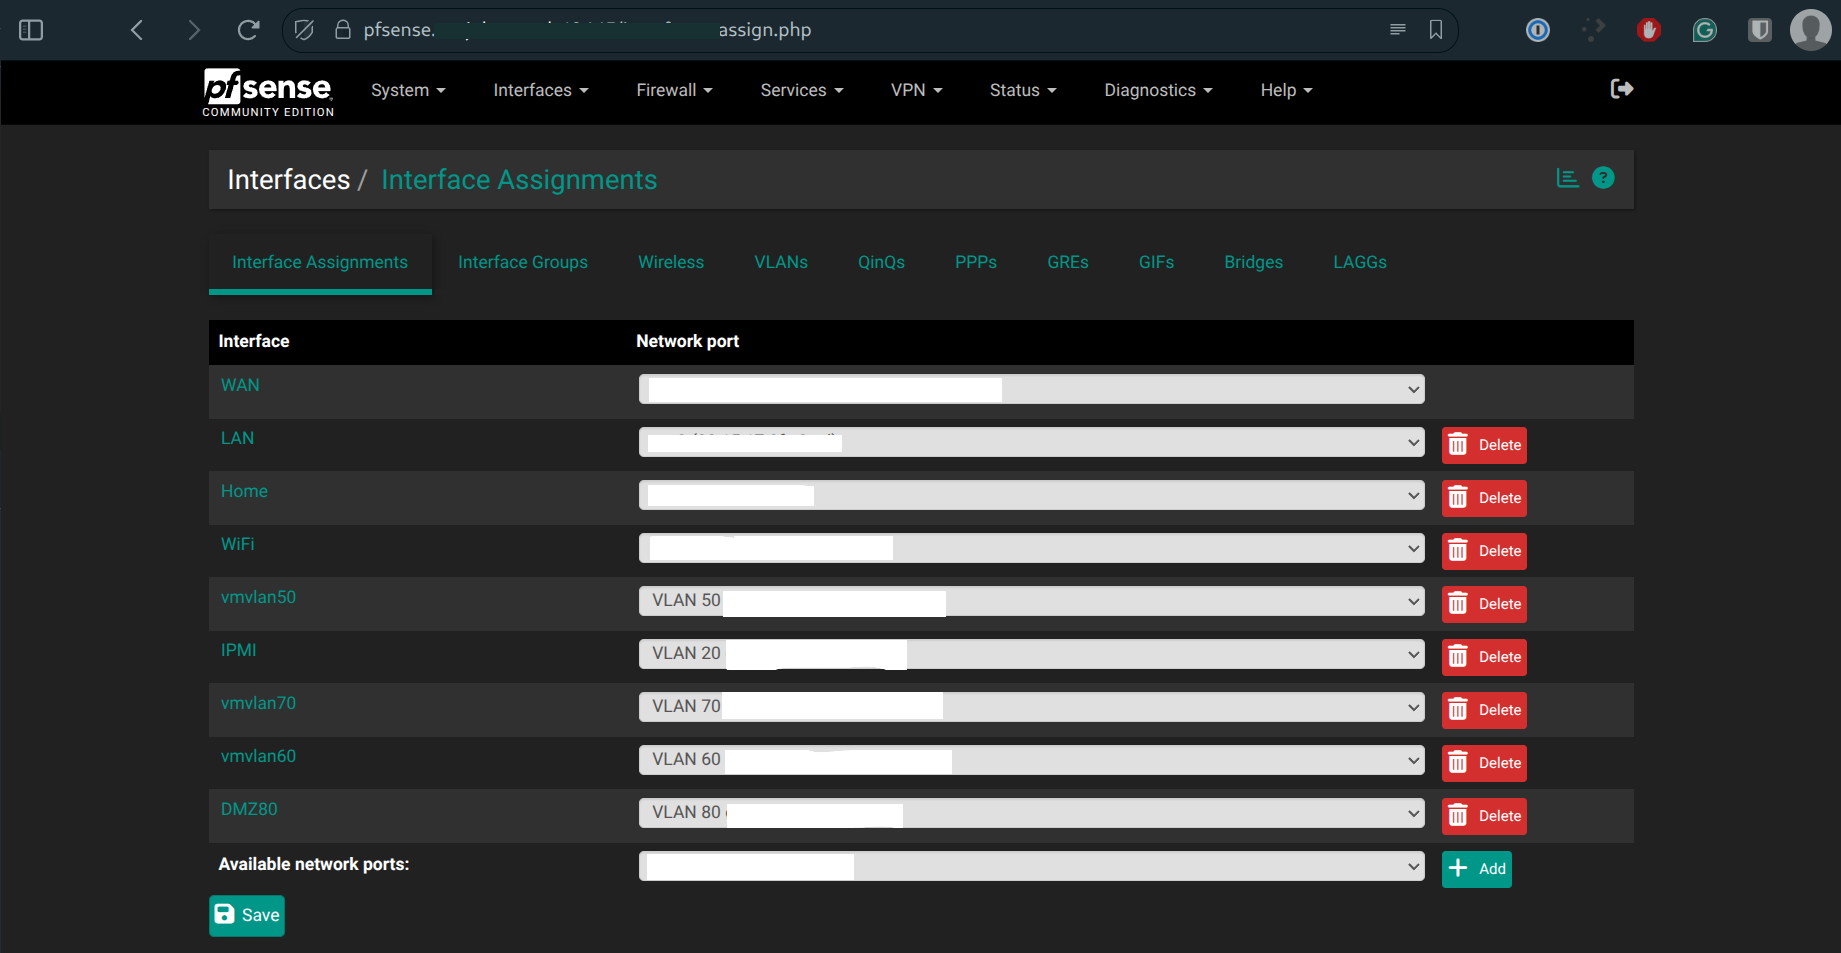
Network design was a priority from the start. pfSense is used as the primary firewall/router, with VLAN segmentation separating Kubernetes, infrastructure, and home network services.
On Proxmox, VLAN tagging is handled by a single Linux bridge (vmbr0), with VLAN IDs assigned to each VM (e.g., VLAN 80 for DMZ workloads). This keeps network separation clean without unnecessary bridge sprawl.
Operational Challenges
Too Many Endpoints
As the homelab expanded, some services were deployed more out of curiosity than necessity. Over time, this resulted in unused workloads consuming storage and memory.
Mixed Environments
Running both Kubernetes and Docker was intentional, but it introduced complexity. Not all workloads belonged in Kubernetes, nor did all monitoring dashboards need to be duplicated.
Visibility vs Security
Some internal services (such as infrastructure management interfaces) should remain reachable but not actively monitored or health-checked. Balancing visibility without increasing the attack surface became an important design consideration.
The Access Layer: Homepage
The homepage was chosen as the access layer because it integrates well with Kubernetes while remaining lightweight and highly configurable.
Key reasons for choosing Homepage:
- Kubernetes-aware service discovery
- Flexible grouping of services by environment
- Support for widgets, metrics, and external links
- Minimal resource footprint
Rather than treating Homepage as a monitoring replacement, it serves as an operational control plane, a place to observe, access, and reason about the platform as a whole.
Security
Several deliberate security choices shaped the final design:
- Domain separation: Kubernetes services, infrastructure tools, and home network services use separate domains
- No ICMP workarounds: Services that don’t respond cleanly to health checks are not forced to
- Intentional “no status” tiles: Some services (e.g., IPMI) are linked for access only and are not proxied or monitored
These decisions prioritise reliability and security over cosmetic completeness.
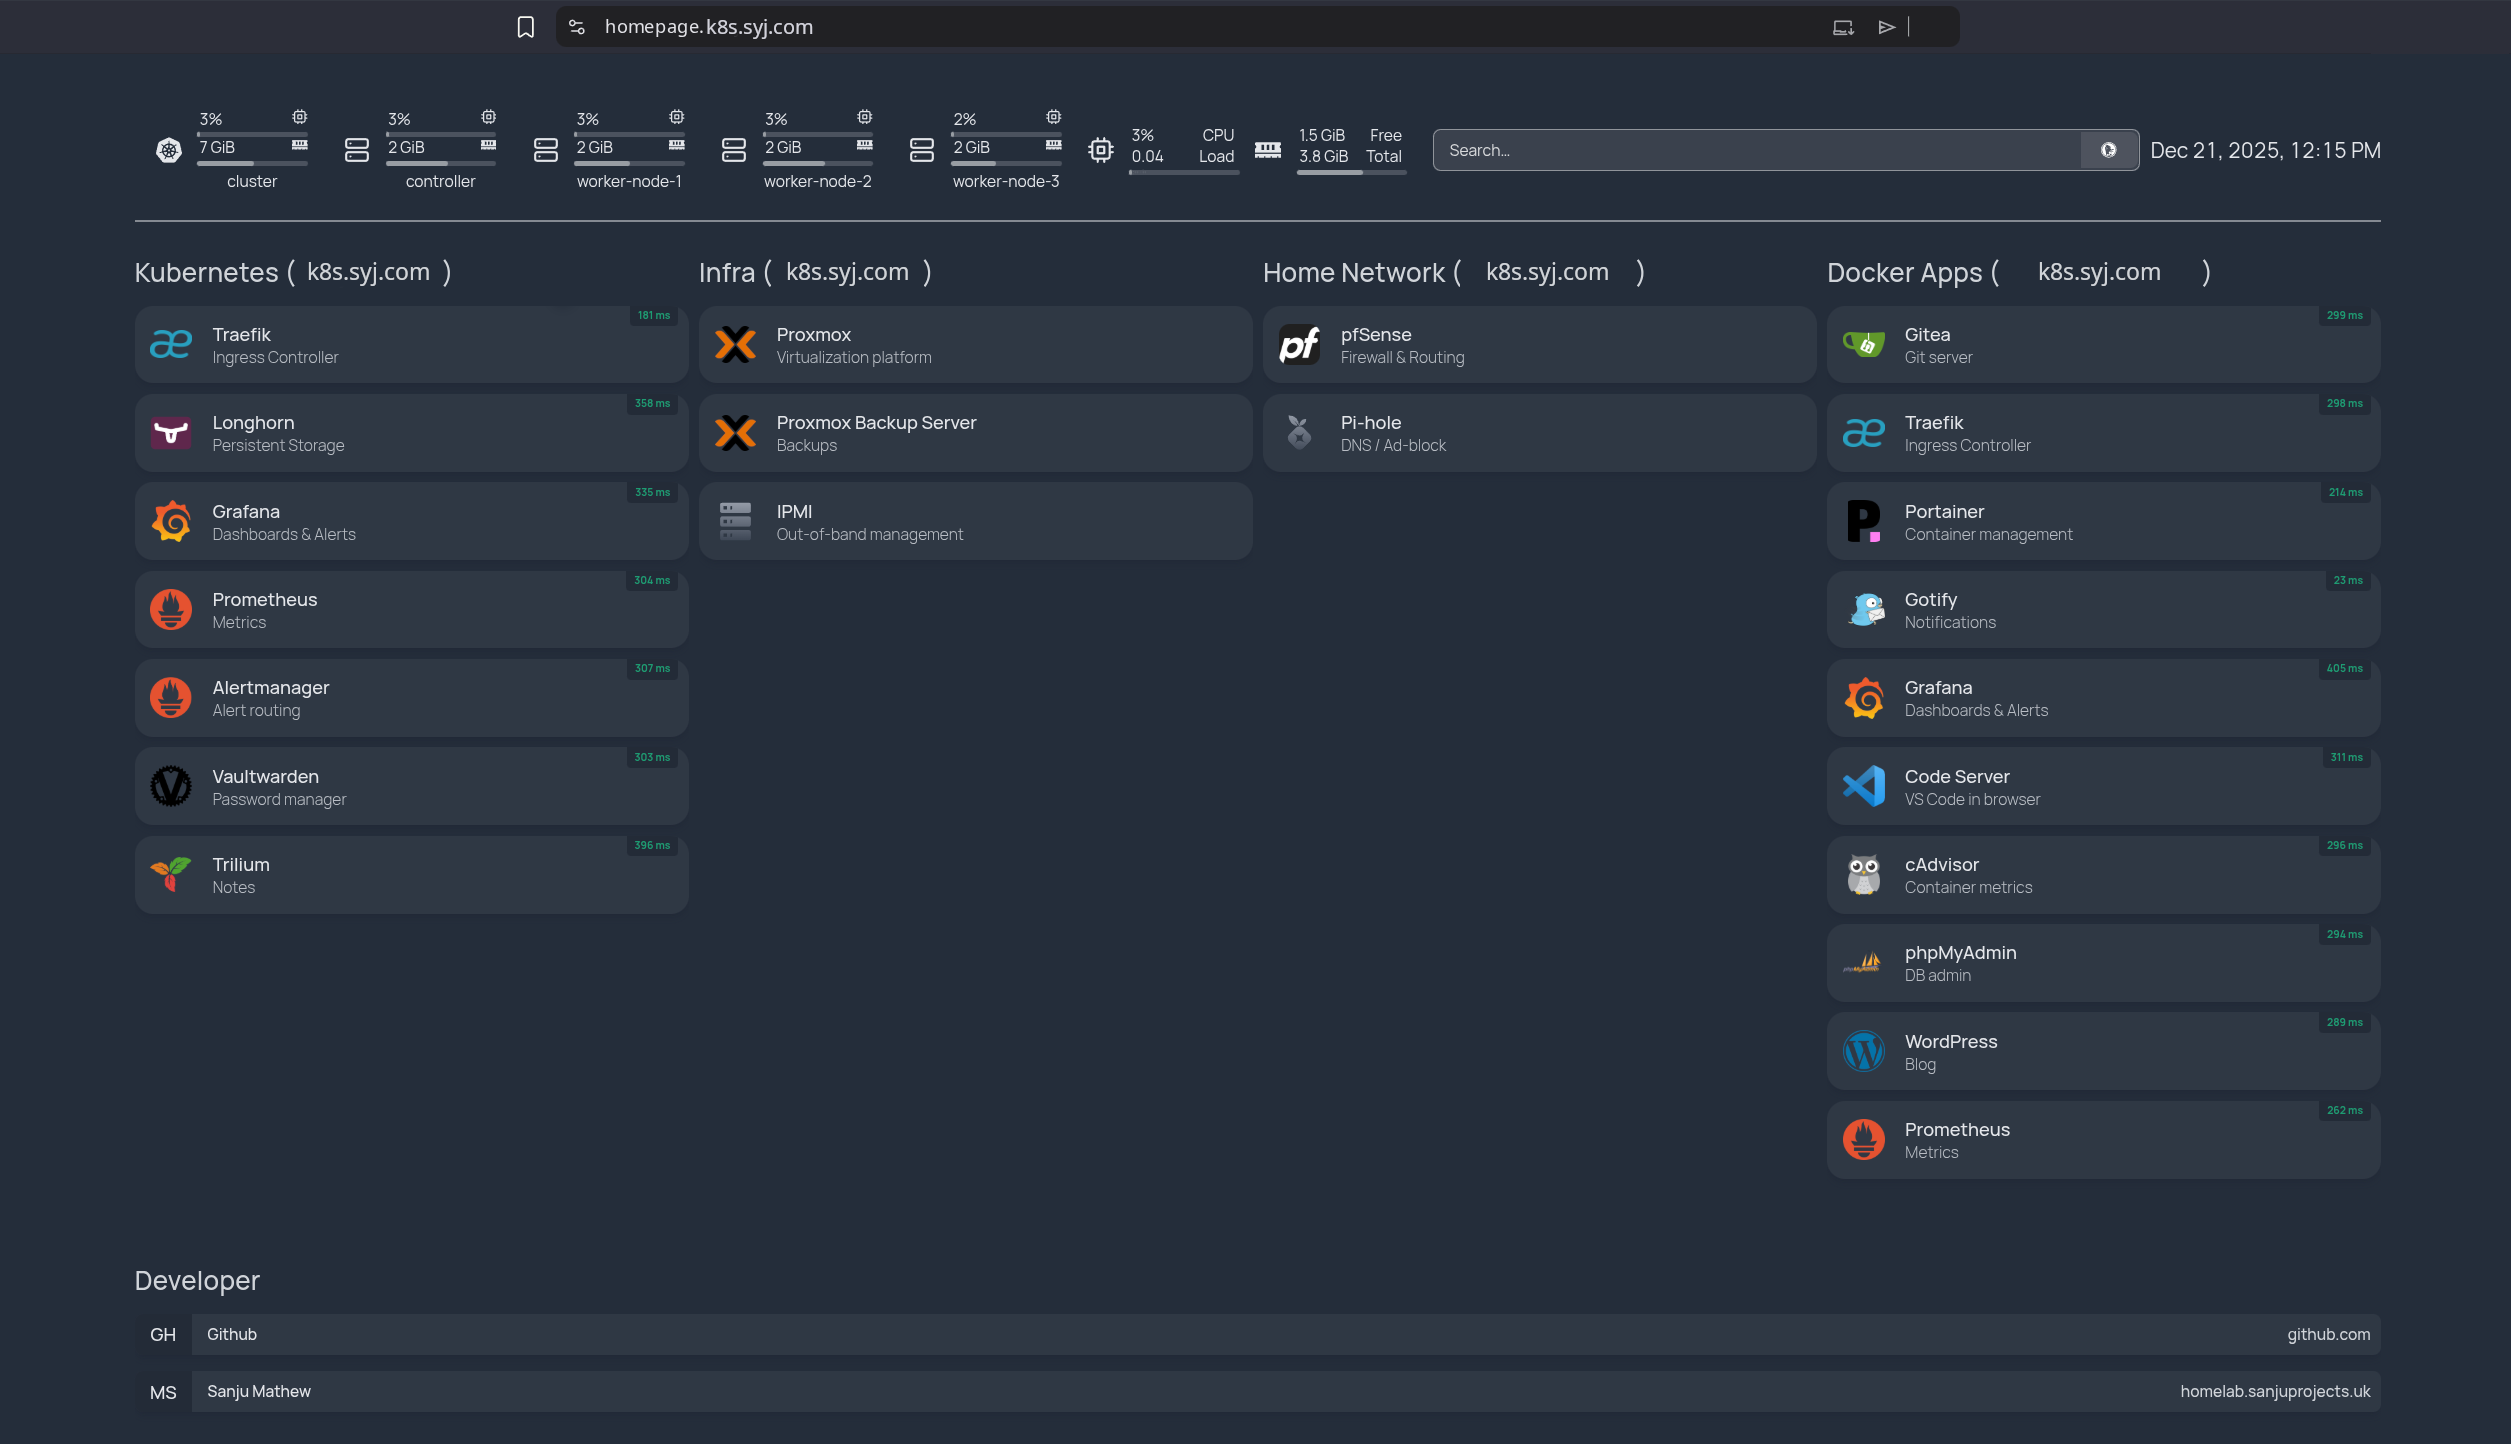
Final Result
The result is a clean, low-noise dashboard that provides:
- A unified view of Kubernetes, Docker, and infrastructure services
- Clear separation between environments
- Immediate access to critical tools
- Reduced operational overhead
(Domain names in screenshots have been anonymised to avoid exposing internal infrastructure details.)