
Building a Robust Homelab Monitoring System with Grafana and Prometheus
Introduction
As the number of self-hosted applications on my Proxmox-based homelab grew, eventually reaching over 15, I realised the importance of having a centralised and powerful monitoring solution. While I initially relied on Uptime Kuma for basic uptime monitoring, I needed a more comprehensive and flexible tool to monitor system health, resource usage, and performance metrics. This led me to explore the combination of Grafana and Prometheus.
This blog post documents my journey of setting up a complete monitoring stack using Docker, Traefik, Grafana, and Prometheus. I’ll also share some insights into my architecture, best practices I followed, and lessons I learned along the way.
Key Components in My Setup
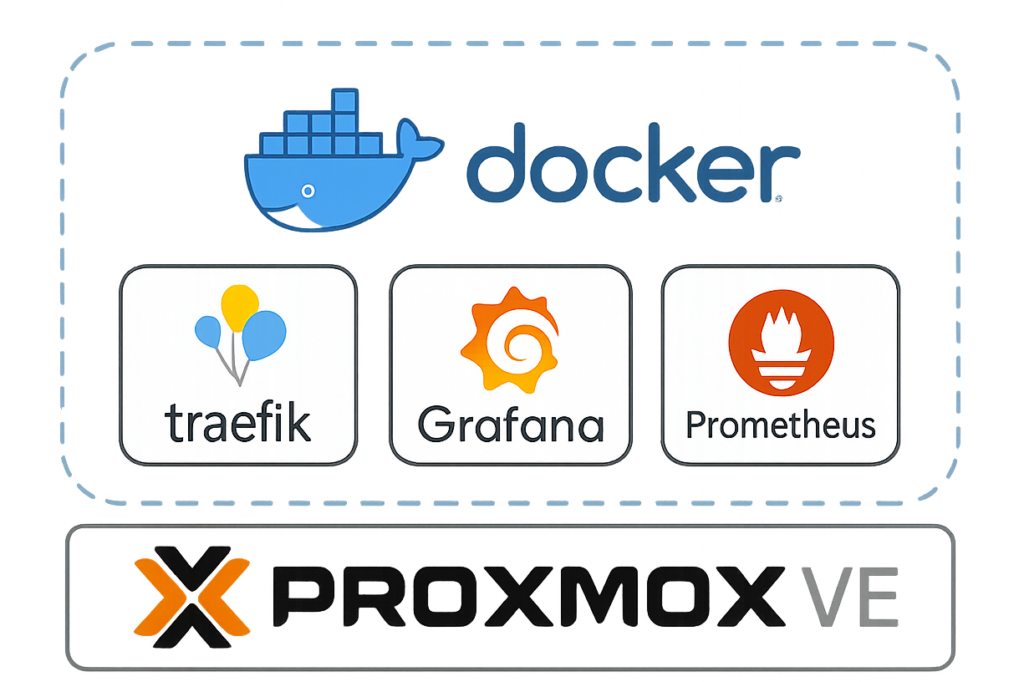
My stack includes:
- Proxmox VE: Virtualisation platform.
- Debian 12: Stable Linux base for Docker.
- Docker & Docker Compose: Containers & orchestration.
- Traefik Proxy: Reverse proxy & SSL termination.
- Grafana: Visualisation and alerting dashboard.
- Prometheus: Metrics collection and monitoring.
- Node Exporter: Host metrics exporter.
- Cadvisor: Docker container metrics exporter.
Proxmox VE
My virtualisation platform of choice is Proxmox VE, an incredibly reliable and user-friendly hypervisor. It enables me to run multiple virtual machines and containers efficiently. I created a new virtual machine for this project using a Debian 12 template, which serves as the Docker host.
Docker and Docker Compose
I installed Docker and Docker Compose on the Debian VM. I chose to manage each application with its docker-compose.yml file. This modular approach gives me fine-grained control over individual deployments and simplifies maintenance and troubleshooting.
Reverse Proxy with Traefik
To streamline external access and ensure secure connections, I integrated Traefik as my reverse proxy. Traefik automatically handles SSL certificate generation and renewal via Let’s Encrypt, making it incredibly convenient to deploy HTTPS-enabled services.
All containers that need to be accessed externally are connected to a shared Docker network named proxy. This allows Traefik to route traffic efficiently to each service based on hostnames and labels defined in the Docker Compose configurations.
Example Traefik labels:
labels:
  - "traefik.enable=true"

  # HTTP router → redirect to HTTPS
  - "traefik.http.routers.grafana.entrypoints=http"
  - "traefik.http.routers.grafana.rule=Host(`grafana.example.com`)"
  - "traefik.http.middlewares.grafana-https-redirect.redirectscheme.scheme=https"
  - "traefik.http.routers.grafana.middlewares=grafana-https-redirect"

  # HTTPS router (TLS + optional middlewares)
  - "traefik.http.routers.grafana-secure.entrypoints=https"
  - "traefik.http.routers.grafana-secure.rule=Host(`grafana.example.com`)"
  - "traefik.http.routers.grafana-secure.tls=true"
  - "traefik.http.routers.grafana-secure.tls.certresolver=cloudflare"     # or your resolver name
  - "traefik.http.routers.grafana-secure.service=grafana"
  - "traefik.http.services.grafana.loadbalancer.server.port=3000"
  - "traefik.docker.network=proxy"

  # (Optional but recommended)
  # - "traefik.http.routers.grafana-secure.middlewares=crowdsec-bouncer@file,secure-headers@file,grafana-auth@file"
Grafana: Beautiful Dashboards and Alerts
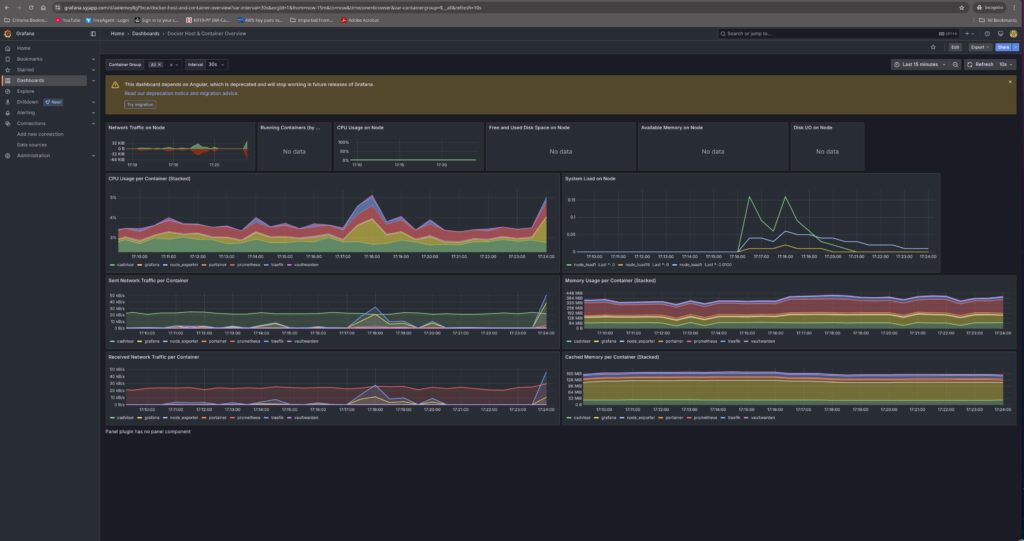
Grafana is the heart of my monitoring dashboard. It connects to Prometheus and presents metrics in beautiful, customizable dashboards. Whether it’s CPU load, memory usage, or Docker container stats, Grafana makes it easy to visualise everything in real-time.
I added a few plugins, such as the grafana-clock-panel grafana-simple-json-datasource to enhance the dashboard experience. Grafana is also behind Traefik for secure, authenticated access.
Beyond visualisations, Grafana also provides robust alerting capabilities. I configured alerts to notify me via email and Telegram when specific thresholds are exceeded, like high CPU or disk usage.
Prometheus: Powerful Metrics Collection
Prometheus is responsible for scraping and storing all metrics data. Its pull-based model and powerful query language, PromQL, make it an excellent choice for small- and large-scale monitoring setups.
My prometheus.yml The config includes jobs for:
- Prometheus itself (self-monitoring)
- Cadvisor (container metrics)
- Node Exporter (host metrics)
Here’s a simplified example:
---
global:
  scrape_interval: 15s  # By default, scrape targets every 15 seconds.

  # Attach these labels to any time series or alerts when communicating with
  # external systems (federation, remote storage, Alertmanager).
  # external_labels:
  #  monitor: 'codelab-monitor'

# A scrape configuration containing exactly one endpoint to scrape:
# Here it's Prometheus itself.
scrape_configs:
  # The job name is added as a label `job=<job_name>` to any timeseries scraped from this config.
  - job_name: 'prometheus'
    # Override the global default and scrape targets from this job every 5 seconds.
    scrape_interval: 5s
    static_configs:
      - targets: ['localhost:9090']

# Example job for node_exporter

  - job_name: 'node_exporter'
    static_configs:
      - targets: ['192.168.80.40:9100']

# Example job for cadvisor

  - job_name: 'cadvisor'
    static_configs:
- targets: ['cadvisor:8080']Exporters: Gathering the Right Data
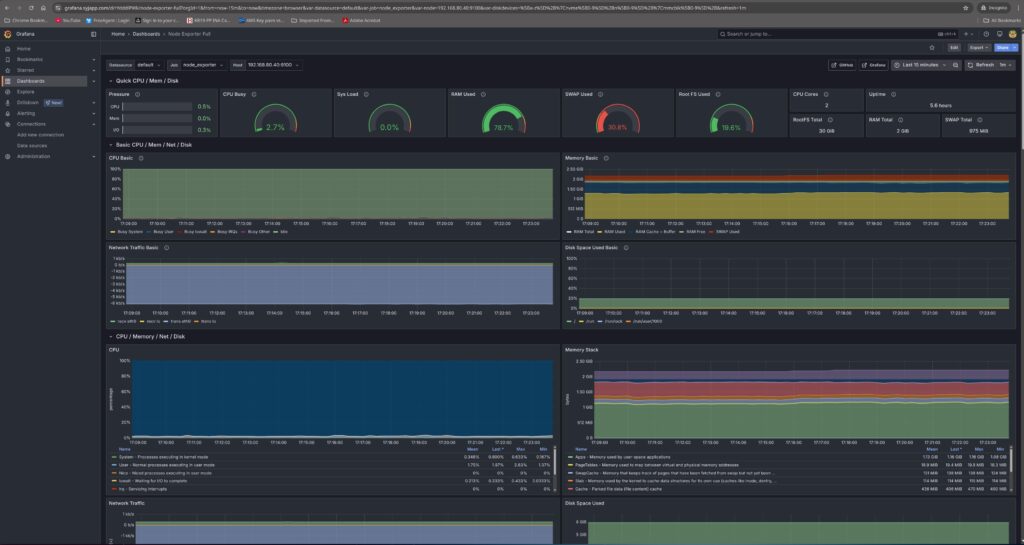
Node Exporter
Node Exporter collects system-level metrics from the Docker host, such as CPU, memory, disk, and network usage. Initially, I faced issues scraping data when Node Exporter was connected to the proxy network. Creating a separate network resolved the issue.
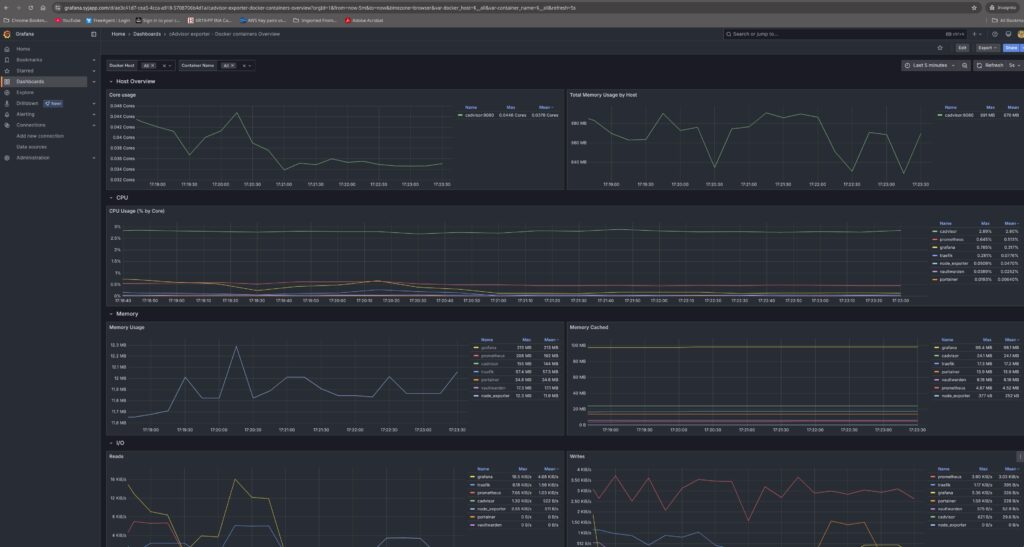
Cadvisor
Cadvisor, developed by Google, collects resource usage and performance metrics from running Docker containers. It’s easy to deploy and integrates seamlessly with Prometheus. However, like Node Exporter and Prometheus, it lacks authentication, so isolating it within your internal network is essential.
Security Best Practices
- Traefik Authentication: Use middleware like basic auth or OAuth to protect sensitive dashboards.
- Network Isolation: Restrict access to Prometheus, Cadvisor, and Node Exporter using Docker networks or firewall rules.
- SSL Certificates: Ensure all external access is routed through HTTPS using Traefik.
- Data Persistence: Mount volumes for both Grafana and Prometheus to retain historical data across container restarts.
Future Enhancements
- Log Monitoring with Loki: Integrate Grafana Loki and Promtail for centralised log collection and analysis.
- External Monitoring: Use Blackbox Exporter to check external websites and APIs.
- Advanced Alerting: Configure more complex alert rules and expand notification channels.
If you prefer a visual walkthrough or want to follow along step-by-step, check out my video tutorial covering the entire setup:
In the video, I cover:
- Creating a Docker host on Proxmox
- Deploying Prometheus, Grafana, Node Exporter, Cadvisor and a few other Docker apps
- Configuring Traefik with SSL and secure routing
- Setting up monitoring dashboards and alerts
- Troubleshooting common networking issues
Final Thoughts
This project gave me valuable hands-on experience with enterprise-grade tools. Setting up Grafana and Prometheus in a Docker environment helped me understand system monitoring from the ground up. With this setup in place, I now have deep visibility into my homelab’s health and performance, and the flexibility to grow and adapt it as needed.
If you’re running multiple services at home or in a lab environment, I highly recommend investing time in a similar setup. It’s a rewarding learning experience and gives you the tools to manage your infrastructure like a pro.
My Docker-Compose file for Prometheus and Cadvisor.
services:
  prometheus:
    image: prom/prometheus:latest
    container_name: prometheus
    restart: unless-stopped
    security_opt:
      - no-new-privileges:true   # helps to increase security
    networks:
      - proxy
    command:
      - "--config.file=/etc/prometheus/prometheus.yml"
    env_file:
      - .env   # store secrets separately if needed
    volumes:
      - ./config/prometheus.yml:/etc/prometheus/prometheus.yml:ro
      - prometheus-data:/prometheus
    labels:
      - "traefik.enable=true"

      # HTTP router (redirect only)
      - "traefik.http.routers.prometheus.entrypoints=http"
      - "traefik.http.routers.prometheus.rule=Host(`prometheus.example.com`)"
      - "traefik.http.routers.prometheus.middlewares=prometheus-https-redirect@file"

      # HTTPS router (auth + CrowdSec)
      - "traefik.http.routers.prometheus-secure.entrypoints=https"
      - "traefik.http.routers.prometheus-secure.rule=Host(`prometheus.example.com`)"
      - "traefik.http.routers.prometheus-secure.tls=true"
      - "traefik.http.routers.prometheus-secure.middlewares=prometheus-auth@file,crowdsec-bouncer@file"
      - "traefik.http.routers.prometheus-secure.service=prometheus"
      - "traefik.http.services.prometheus.loadbalancer.server.port=9090"
      - "traefik.docker.network=proxy"

  node_exporter:
    image: quay.io/prometheus/node-exporter:latest
    container_name: node_exporter
    restart: unless-stopped
    command:
      - "--path.rootfs=/host"
    pid: host
    volumes:
      - /:/host:ro,rslave

  cadvisor:
    image: gcr.io/cadvisor/cadvisor:v0.52.1
    container_name: cadvisor
    restart: unless-stopped
    ports:
      - "8080:8080"   # optional direct access (Traefik will also proxy)
    networks:
      - proxy
    volumes:
      - /:/rootfs:ro
      - /var/run:/var/run:ro
      - /sys:/sys:ro
      - /var/lib/docker/:/var/lib/docker:ro
      - /dev/disk/:/dev/disk:ro
    devices:
      - /dev/kmsg
    labels:
      - "traefik.enable=true"

      # HTTP router (redirect only)
      - "traefik.http.routers.cadvisor.entrypoints=http"
      - "traefik.http.routers.cadvisor.rule=Host(`cadvisor.example.com`)"
      - "traefik.http.routers.cadvisor.middlewares=cadvisor-https-redirect@file"

      # HTTPS router (auth + CrowdSec)
      - "traefik.http.routers.cadvisor-secure.entrypoints=https"
      - "traefik.http.routers.cadvisor-secure.rule=Host(`cadvisor.example.com`)"
      - "traefik.http.routers.cadvisor-secure.tls=true"
      - "traefik.http.routers.cadvisor-secure.middlewares=cadvisor-auth@file,crowdsec-bouncer@file"
      - "traefik.http.routers.cadvisor-secure.service=cadvisor"
      - "traefik.http.services.cadvisor.loadbalancer.server.port=8080"
      - "traefik.docker.network=proxy"

volumes:
  prometheus-data:
    external: true

networks:
  proxy:
    external: true
My Docker-Compose file for Grafana.
version: "3.9"

services:
  grafana:
    image: grafana/grafana-enterprise:latest   # or grafana/grafana:latest
    container_name: grafana
    restart: unless-stopped
    # ports:
    #   - "3000:3000"                          # optional: expose directly
    user: "0"                                   # or set a non-root UID/GID if you prefer
    volumes:
      - grafana-storage:/var/lib/grafana
    networks:
      - proxy
    environment:
      # Preinstall useful plugins (optional)
      - GF_INSTALL_PLUGINS=grafana-clock-panel,grafana-simple-json-datasource

    labels:
      - "traefik.enable=true"

      # HTTP router (redirect -> HTTPS)
      - "traefik.http.routers.grafana.entrypoints=http"
      - "traefik.http.routers.grafana.rule=Host(`grafana.example.com`)"
      - "traefik.http.routers.grafana.middlewares=grafana-https-redirect@file"

      # HTTPS router (optionally add auth + CrowdSec)
      - "traefik.http.routers.grafana-secure.entrypoints=https"
      - "traefik.http.routers.grafana-secure.rule=Host(`grafana.example.com`)"
      - "traefik.http.routers.grafana-secure.tls=true"
      - "traefik.http.routers.grafana-secure.service=grafana"
      - "traefik.http.services.grafana.loadbalancer.server.port=3000"
      - "traefik.docker.network=proxy"
      # If you use extra protection, uncomment and define these middlewares in Traefik config:
      # - "traefik.http.routers.grafana-secure.middlewares=grafana-auth@file,crowdsec-bouncer@file"

volumes:
  grafana-storage: {}

networks:
  proxy:
    external: true